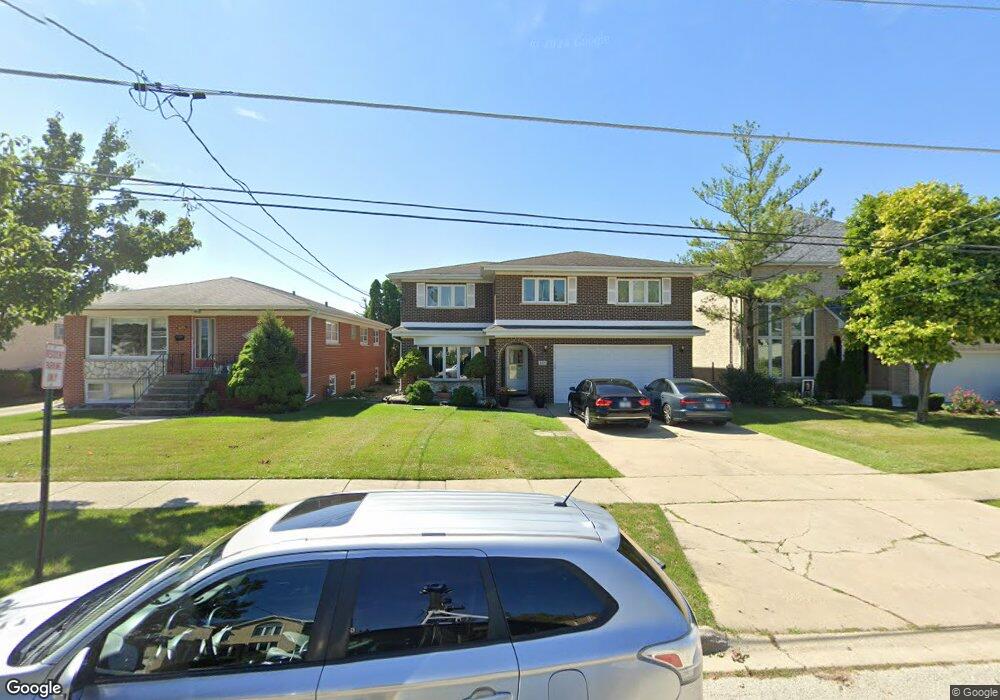
8727 W Stolting Rd Niles, IL 60714
Ransom Ridge NeighborhoodEstimated Value: $720,000 - $875,000
4
Beds
3
Baths
3,232
Sq Ft
$241/Sq Ft
Est. Value
About This Home
This home is located at 8727 W Stolting Rd, Niles, IL 60714 and is currently estimated at $779,168, approximately $241 per square foot. 8727 W Stolting Rd is a home located in Cook County with nearby schools including Mark Twain Elementary School, Gemini Middle School, and Maine East High School.
Ownership History
Date
Name
Owned For
Owner Type
Purchase Details
Closed on
May 5, 2023
Sold by
Arifi Bashlcim S and Arifi Fatima
Bought by
Arifi Shklgesa and Arifi Betim
Current Estimated Value
Home Financials for this Owner
Home Financials are based on the most recent Mortgage that was taken out on this home.
Original Mortgage
$405,000
Outstanding Balance
$394,708
Interest Rate
6.88%
Mortgage Type
New Conventional
Estimated Equity
$384,460
Purchase Details
Closed on
Dec 15, 2000
Sold by
Zipp Thomas M and Zipp Maria
Bought by
Arifi Bashkim S and Arifi Fatima
Home Financials for this Owner
Home Financials are based on the most recent Mortgage that was taken out on this home.
Original Mortgage
$252,700
Interest Rate
7.77%
Mortgage Type
Purchase Money Mortgage
Create a Home Valuation Report for This Property
The Home Valuation Report is an in-depth analysis detailing your home's value as well as a comparison with similar homes in the area
Home Values in the Area
Average Home Value in this Area
Purchase History
| Date | Buyer | Sale Price | Title Company |
|---|---|---|---|
| Arifi Shklgesa | $630,000 | None Listed On Document | |
| Arifi Bashkim S | $455,000 | -- |
Source: Public Records
Mortgage History
| Date | Status | Borrower | Loan Amount |
|---|---|---|---|
| Open | Arifi Shklgesa | $405,000 | |
| Previous Owner | Arifi Bashkim S | $252,700 |
Source: Public Records
Tax History Compared to Growth
Tax History
| Year | Tax Paid | Tax Assessment Tax Assessment Total Assessment is a certain percentage of the fair market value that is determined by local assessors to be the total taxable value of land and additions on the property. | Land | Improvement |
|---|---|---|---|---|
| 2024 | $12,028 | $50,000 | $10,285 | $39,715 |
| 2023 | $11,272 | $50,000 | $10,285 | $39,715 |
| 2022 | $11,272 | $50,000 | $10,285 | $39,715 |
| 2021 | $11,567 | $43,190 | $8,415 | $34,775 |
| 2020 | $11,000 | $43,190 | $8,415 | $34,775 |
| 2019 | $12,347 | $54,671 | $8,415 | $46,256 |
| 2018 | $12,041 | $48,583 | $7,246 | $41,337 |
| 2017 | $11,938 | $48,583 | $7,246 | $41,337 |
| 2016 | $12,660 | $53,877 | $7,246 | $46,631 |
| 2015 | $11,594 | $45,727 | $6,077 | $39,650 |
| 2014 | $11,200 | $45,727 | $6,077 | $39,650 |
| 2013 | $10,983 | $45,727 | $6,077 | $39,650 |
Source: Public Records
Map
Nearby Homes
- 8619 W Park Ln
- 8554 W Bruce Dr
- 8426 W Betty Terrace
- 1710 Dempster St Unit C
- 8516 W Normal Ave
- 8905 Knight Ave Unit F211
- 8901 N Western Ave Unit A211
- 1144 N Greenwood Ave
- 8936 N Parkside Ave Unit B108
- 1220 N Hamlin Ave
- 1712 Woodland Ave
- 1720 Greendale Ave
- 1025 N Knight Ave
- 8807 Dee Rd
- 1700 Marguerite St
- 8904 Robin Dr
- 1420 Oakton St
- 1133 Fortuna Ave
- 1041 Vernon Ave
- 8802 Briar Ct Unit 3A
- 8735 W Stolting Rd
- 8725 W Stolting Rd
- 8737 W Stolting Rd
- 8721 W Stolting Rd
- 8739 W Stolting Rd
- 8715 W Stolting Rd
- 8709 W Stolting Rd
- 8728 W Stolting Rd
- 8736 W Stolting Rd
- 8726 W Stolting Rd
- 8726 W Park Ln
- 8525 N Western Ave
- 8724 W Park Ln
- 8730 W Park Ln
- 8738 W Stolting Rd
- 8718 W Stolting Rd
- 8722 W Park Ln
- 8734 W Park Ln
- 8517 N Western Ave
- 8705 W Stolting Rd