Estimated Value: $120,974 - $135,000
1
Bed
1
Bath
811
Sq Ft
$154/Sq Ft
Est. Value
About This Home
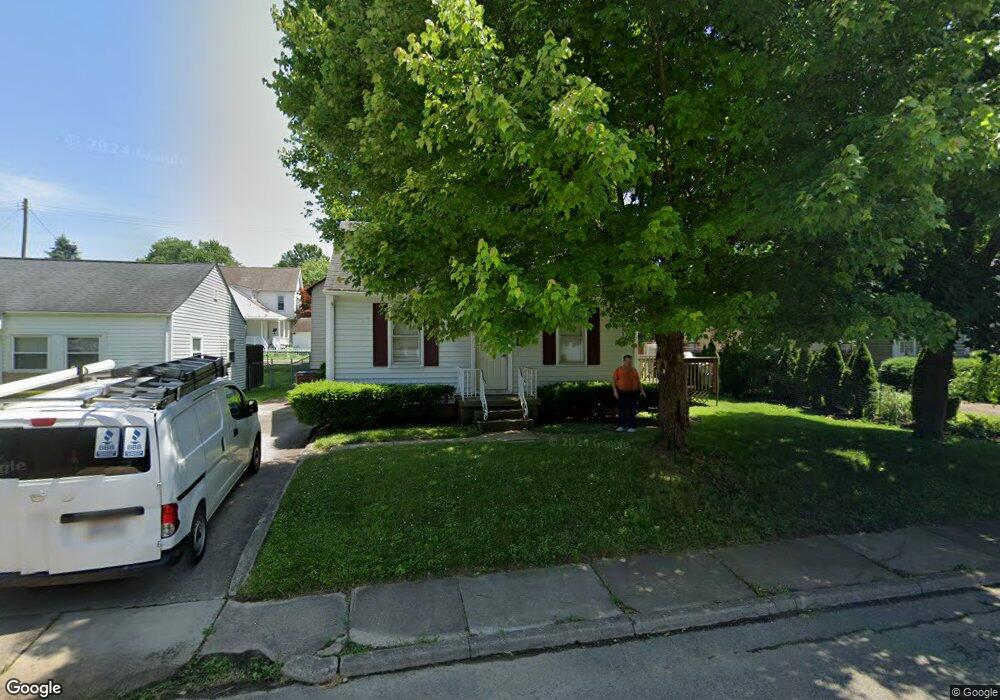
This home is located at 873 Catherine St, Xenia, OH 45385 and is currently estimated at $125,244, approximately $154 per square foot. 873 Catherine St is a home located in Greene County with nearby schools including Xenia High School, Summit Academy Community School for Alternative Learners - Xenia, and Legacy Christian Academy.
Ownership History
Date
Name
Owned For
Owner Type
Purchase Details
Closed on
Sep 15, 2021
Sold by
Pitstick Amanda D and Beckley Amanda D
Bought by
Blackaby Mark
Current Estimated Value
Purchase Details
Closed on
Jul 3, 2007
Sold by
Webster Timothy
Bought by
Pitstick Amanda D
Home Financials for this Owner
Home Financials are based on the most recent Mortgage that was taken out on this home.
Original Mortgage
$54,000
Interest Rate
6.42%
Mortgage Type
Purchase Money Mortgage
Purchase Details
Closed on
Feb 9, 2006
Sold by
Hud
Bought by
Webster Timothy
Purchase Details
Closed on
Oct 4, 2005
Sold by
Mullikin Tony L and Mullikin Sheryl K
Bought by
Hud
Purchase Details
Closed on
Feb 19, 1997
Sold by
Greene Diana L
Bought by
Mullikin Tony L
Home Financials for this Owner
Home Financials are based on the most recent Mortgage that was taken out on this home.
Original Mortgage
$56,150
Interest Rate
7.92%
Mortgage Type
FHA
Create a Home Valuation Report for This Property
The Home Valuation Report is an in-depth analysis detailing your home's value as well as a comparison with similar homes in the area
Home Values in the Area
Average Home Value in this Area
Purchase History
| Date | Buyer | Sale Price | Title Company |
|---|---|---|---|
| Blackaby Mark | -- | None Available | |
| Pitstick Amanda D | $54,000 | Attorney | |
| Webster Timothy | $39,100 | Lakeside Title & Escrow Agen | |
| Hud | $40,000 | -- | |
| Mullikin Tony L | $56,400 | -- |
Source: Public Records
Mortgage History
| Date | Status | Borrower | Loan Amount |
|---|---|---|---|
| Previous Owner | Pitstick Amanda D | $54,000 | |
| Previous Owner | Mullikin Tony L | $56,150 |
Source: Public Records
Tax History Compared to Growth
Tax History
| Year | Tax Paid | Tax Assessment Tax Assessment Total Assessment is a certain percentage of the fair market value that is determined by local assessors to be the total taxable value of land and additions on the property. | Land | Improvement |
|---|---|---|---|---|
| 2024 | $1,005 | $23,480 | $2,630 | $20,850 |
| 2023 | $1,005 | $23,480 | $2,630 | $20,850 |
| 2022 | $879 | $17,520 | $2,100 | $15,420 |
| 2021 | $891 | $17,520 | $2,100 | $15,420 |
| 2020 | $853 | $17,520 | $2,100 | $15,420 |
| 2019 | $892 | $17,240 | $2,760 | $14,480 |
| 2018 | $896 | $17,240 | $2,760 | $14,480 |
| 2017 | $857 | $17,240 | $2,760 | $14,480 |
| 2016 | $858 | $16,200 | $2,760 | $13,440 |
| 2015 | $860 | $16,200 | $2,760 | $13,440 |
| 2014 | $823 | $16,200 | $2,760 | $13,440 |
Source: Public Records
Map
Nearby Homes
- 878 N Detroit St
- 902 N Detroit St
- 613 N West St
- 659 N King St
- 1038 Frederick Dr
- 1171 N Detroit St
- 516 N King St
- 137 Pleasant St
- 509 Antrim Rd
- 883 Omard Dr
- 912 Omard Dr
- 119 Park Dr
- 508 Marshall Dr
- 0 W Church St
- 214 Corwin Ave
- 348 S Stadium Dr
- 479 N Stadium Dr
- 513 Redbud Ln
- 568 Louise Dr
- 1791 Palmer Ct
- 881 Catherine St
- 212 W Ankeney Mill Rd
- 853 Catherine St
- 870 Catherine St
- 250 W Ankeney Mill Rd
- 880 Catherine St
- 830 Florence St
- 830 Florence St
- 901 Catherine St
- 190 W Ankeney Mill Rd
- 190 W Ankeney Mill Rd
- 258 W Ankeney Mill Rd
- 852 Florence St
- 911 Catherine St
- 908 Catherine St
- 908 Catherine St
- 888 Catherine St
- 860 Florence St
- 223 W Ankeney Mill Rd
- 921 Catherine St