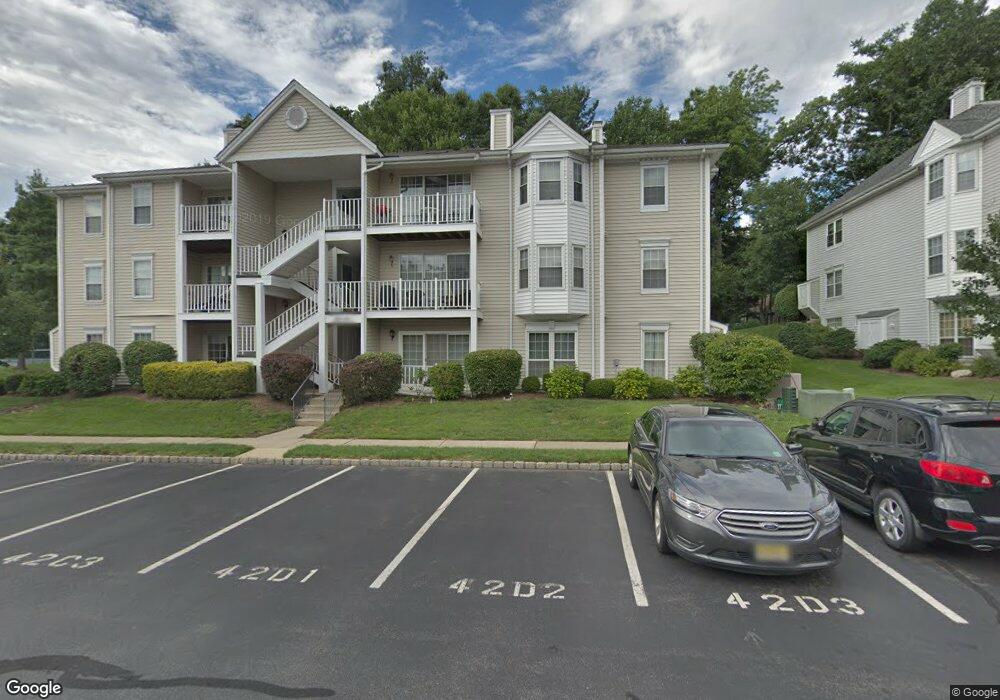
873 Juniper Way Mahwah, NJ 07430
Estimated Value: $502,000 - $529,601
2
Beds
2
Baths
1,108
Sq Ft
$465/Sq Ft
Est. Value
About This Home
This home is located at 873 Juniper Way, Mahwah, NJ 07430 and is currently estimated at $515,400, approximately $465 per square foot. 873 Juniper Way is a home located in Bergen County with nearby schools including Mahwah High School.
Ownership History
Date
Name
Owned For
Owner Type
Purchase Details
Closed on
Aug 30, 2021
Sold by
Kim Soyoun and Kim Inbum
Bought by
Kainatsky Alexander
Current Estimated Value
Home Financials for this Owner
Home Financials are based on the most recent Mortgage that was taken out on this home.
Original Mortgage
$315,000
Outstanding Balance
$286,627
Interest Rate
2.8%
Mortgage Type
New Conventional
Estimated Equity
$228,773
Purchase Details
Closed on
May 8, 2017
Sold by
Farrell Virginia
Bought by
Kim Soyoun and Kim Inbum
Purchase Details
Closed on
Dec 12, 2007
Sold by
Wilson Christie
Bought by
Farrell Virginia
Purchase Details
Closed on
Jun 24, 2004
Sold by
Bigley Dorothy
Bought by
Wilson Christie
Home Financials for this Owner
Home Financials are based on the most recent Mortgage that was taken out on this home.
Original Mortgage
$255,000
Interest Rate
6.32%
Purchase Details
Closed on
Aug 25, 1993
Sold by
Edwards John
Bought by
Bigey Joseph and Bigley Doroghy
Create a Home Valuation Report for This Property
The Home Valuation Report is an in-depth analysis detailing your home's value as well as a comparison with similar homes in the area
Home Values in the Area
Average Home Value in this Area
Purchase History
| Date | Buyer | Sale Price | Title Company |
|---|---|---|---|
| Kainatsky Alexander | $425,000 | None Available | |
| Kim Soyoun | $335,000 | Fidelity National Title | |
| Farrell Virginia | $359,900 | -- | |
| Wilson Christie | $319,000 | -- | |
| Bigey Joseph | $152,500 | -- |
Source: Public Records
Mortgage History
| Date | Status | Borrower | Loan Amount |
|---|---|---|---|
| Open | Kainatsky Alexander | $315,000 | |
| Previous Owner | Wilson Christie | $255,000 |
Source: Public Records
Tax History Compared to Growth
Tax History
| Year | Tax Paid | Tax Assessment Tax Assessment Total Assessment is a certain percentage of the fair market value that is determined by local assessors to be the total taxable value of land and additions on the property. | Land | Improvement |
|---|---|---|---|---|
| 2025 | $6,116 | $296,300 | $175,000 | $121,300 |
| 2024 | $6,036 | $296,300 | $175,000 | $121,300 |
| 2023 | $5,843 | $296,300 | $175,000 | $121,300 |
| 2022 | $5,843 | $296,300 | $175,000 | $121,300 |
| 2021 | $5,253 | $281,400 | $175,000 | $106,400 |
| 2020 | $5,358 | $281,400 | $175,000 | $106,400 |
| 2019 | $5,181 | $281,400 | $175,000 | $106,400 |
| 2018 | $5,107 | $281,400 | $175,000 | $106,400 |
| 2017 | $5,026 | $281,400 | $175,000 | $106,400 |
| 2016 | $4,916 | $281,400 | $175,000 | $106,400 |
| 2015 | $4,849 | $281,400 | $175,000 | $106,400 |
| 2014 | $4,767 | $281,400 | $175,000 | $106,400 |
Source: Public Records
Map
Nearby Homes
- 807 Sassafras Ct
- 707 Pepperidge Rd Unit 30C
- 42 Peterson Place
- 689 Plum Terrace Unit 31E
- 1295 Hibiscus Ct
- 561 Holly Ct Unit B3
- 206 Peterson Place
- 309 Linden St
- 366 Cottonwood Way
- 88 Manor Dr
- 2009 Hawthorne Ln Unit 2009
- 188 Grandview Ln
- 146 Myrtle Ave
- 1904 Faulkner Ct
- 1006 Thoreau Ct
- 1006 Thoreau Ct Unit Bldg 10
- 1007 Thoreau Ct
- 1008 Thoreau Ct
- 916 Thoreau Ct
- 506 Mark Twain Way
- 874 Juniper Way
- 879 Juniper Way
- 871 Juniper Way
- 872 Juniper Way Unit D3
- 870 Juniper Way
- 877 Juniper Way
- 878 Juniper Way
- 876 Juniper Way
- 875 Juniper Way
- 868 Juniper Way
- 866 Juniper Way
- 869 Juniper Way Unit B3
- 867 Juniper Way
- 860 Juniper Way
- 863 Juniper Way
- 864 Juniper Way
- 862 Juniper Way
- 855 Juniper Way
- 858 Juniper Way
- 834 Juniper Way