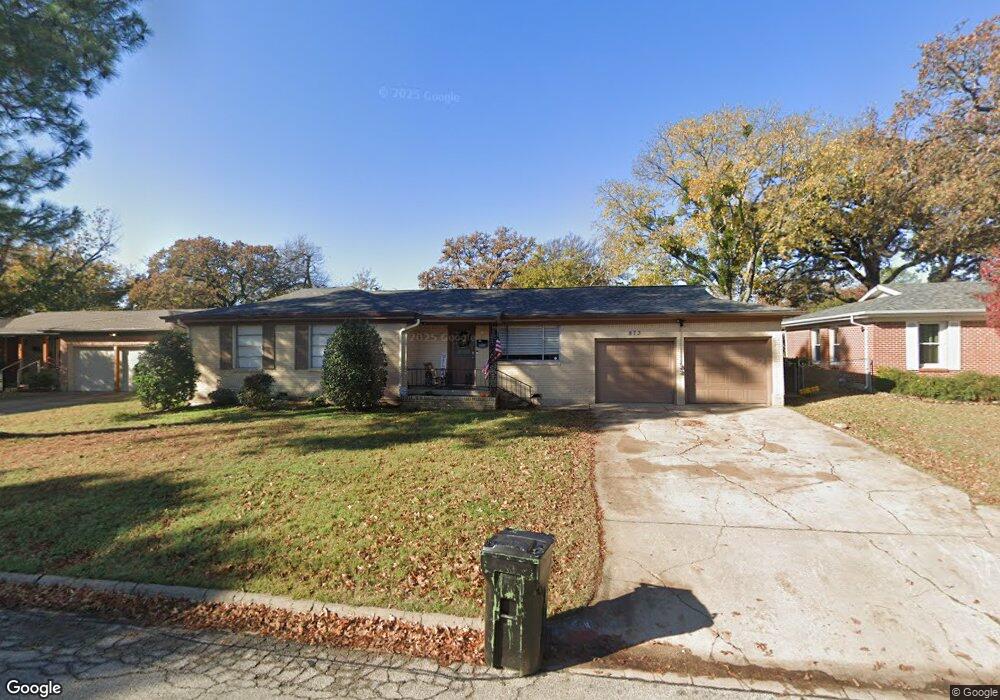
873 Lee Dr Bedford, TX 76022
Estimated Value: $283,000 - $352,000
4
Beds
2
Baths
1,441
Sq Ft
$212/Sq Ft
Est. Value
About This Home
This home is located at 873 Lee Dr, Bedford, TX 76022 and is currently estimated at $304,795, approximately $211 per square foot. 873 Lee Dr is a home located in Tarrant County with nearby schools including Stonegate Elementary School, Central J High School, and L.D. Bell High School.
Ownership History
Date
Name
Owned For
Owner Type
Purchase Details
Closed on
Dec 23, 2015
Sold by
Raider Property Investments Llc
Bought by
Torres Mark and Bailey Kourtney
Current Estimated Value
Home Financials for this Owner
Home Financials are based on the most recent Mortgage that was taken out on this home.
Original Mortgage
$152,093
Outstanding Balance
$121,273
Interest Rate
4.12%
Mortgage Type
FHA
Estimated Equity
$183,522
Purchase Details
Closed on
Aug 4, 2015
Sold by
Digivanni Anthony and Digivanni Azalia
Bought by
Raider Property Investment Llc
Purchase Details
Closed on
Jun 1, 2009
Sold by
Vanhorn Bradley C
Bought by
Digiovanni Anthony and Digiovanni Azalia
Home Financials for this Owner
Home Financials are based on the most recent Mortgage that was taken out on this home.
Original Mortgage
$116,844
Interest Rate
4.72%
Mortgage Type
FHA
Purchase Details
Closed on
Sep 8, 2006
Sold by
Gieb Robert J
Bought by
Vanhorn Bradley C
Home Financials for this Owner
Home Financials are based on the most recent Mortgage that was taken out on this home.
Original Mortgage
$63,600
Interest Rate
6.64%
Mortgage Type
Purchase Money Mortgage
Create a Home Valuation Report for This Property
The Home Valuation Report is an in-depth analysis detailing your home's value as well as a comparison with similar homes in the area
Home Values in the Area
Average Home Value in this Area
Purchase History
| Date | Buyer | Sale Price | Title Company |
|---|---|---|---|
| Torres Mark | -- | Freedom Title Company | |
| Raider Property Investment Llc | $94,000 | None Available | |
| Digiovanni Anthony | -- | Hftc | |
| Vanhorn Bradley C | -- | None Available |
Source: Public Records
Mortgage History
| Date | Status | Borrower | Loan Amount |
|---|---|---|---|
| Open | Torres Mark | $152,093 | |
| Previous Owner | Digiovanni Anthony | $116,844 | |
| Previous Owner | Vanhorn Bradley C | $63,600 |
Source: Public Records
Tax History Compared to Growth
Tax History
| Year | Tax Paid | Tax Assessment Tax Assessment Total Assessment is a certain percentage of the fair market value that is determined by local assessors to be the total taxable value of land and additions on the property. | Land | Improvement |
|---|---|---|---|---|
| 2025 | $3,579 | $273,404 | $65,000 | $208,404 |
| 2024 | $3,579 | $273,404 | $65,000 | $208,404 |
| 2023 | $4,284 | $259,441 | $45,000 | $214,441 |
| 2022 | $4,435 | $226,431 | $45,000 | $181,431 |
| 2021 | $4,348 | $200,094 | $45,000 | $155,094 |
| 2020 | $3,990 | $167,810 | $45,000 | $122,810 |
| 2019 | $4,105 | $168,968 | $45,000 | $123,968 |
| 2018 | $3,628 | $165,064 | $22,000 | $143,064 |
| 2017 | $3,630 | $156,306 | $22,000 | $134,306 |
| 2016 | $3,300 | $136,416 | $22,000 | $114,416 |
| 2015 | $3,335 | $132,800 | $18,000 | $114,800 |
| 2014 | $3,335 | $132,800 | $18,000 | $114,800 |
Source: Public Records
Map
Nearby Homes
- 849 Russell Ln
- 933 Wade Dr
- 1008 Russell Ln
- 341 Hurst Dr
- 1108 Wade Dr
- 501 Merrill Dr
- 344 Bedford Ct E
- 832 Chateau Valee Cir
- 803 Glenda Dr
- 604 Donna Ln
- 1236 King Dr
- 802 Brown Trail
- 905 Brown Trail
- 1200 Tanglewood Trail
- 909 Overhill Dr
- 49 Coffee Tavern Rd
- 921 Overhill Dr
- 1204 Edgecliff Dr
- 1004 Overhill Dr
- 1213 Briar Dr