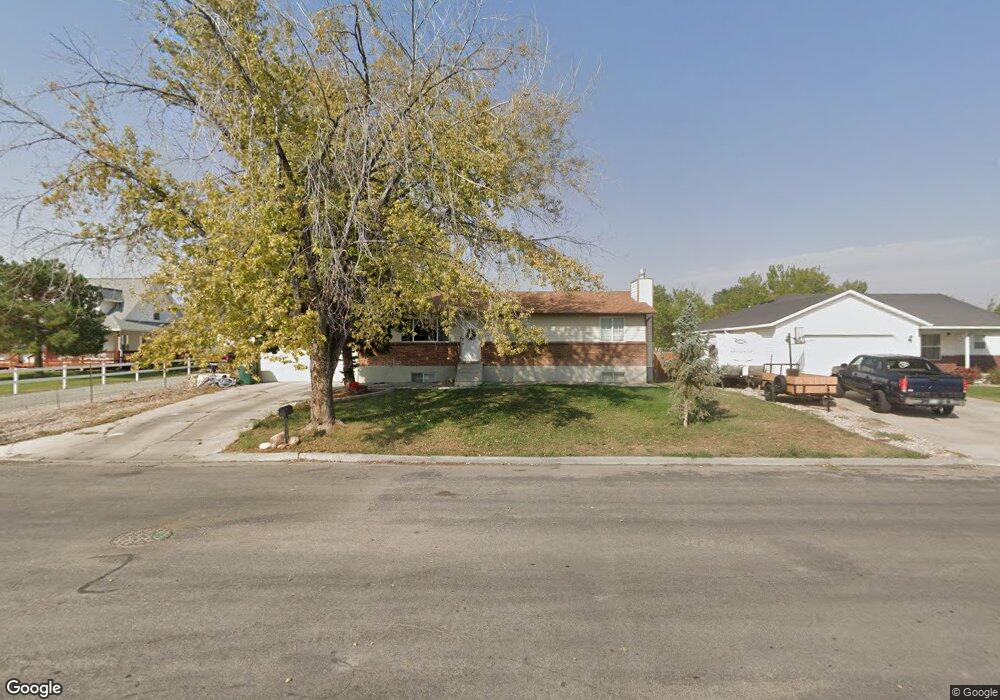
873 N 2050 W Vernal, UT 84078
Estimated Value: $266,622 - $354,000
4
Beds
2
Baths
2,300
Sq Ft
$135/Sq Ft
Est. Value
About This Home
This home is located at 873 N 2050 W, Vernal, UT 84078 and is currently estimated at $310,906, approximately $135 per square foot. 873 N 2050 W is a home located in Uintah County with nearby schools including Maeser School, Uintah Middle School, and Vernal Middle School.
Ownership History
Date
Name
Owned For
Owner Type
Purchase Details
Closed on
Aug 29, 2025
Sold by
Livingston Randall C and Livingston Emilee A
Bought by
Livingston Emilee A and Hartman Jenny Ann
Current Estimated Value
Purchase Details
Closed on
Jun 28, 2010
Sold by
Mittanck Properties Llc
Bought by
Livingston Randall C and Livingston Emilee A
Home Financials for this Owner
Home Financials are based on the most recent Mortgage that was taken out on this home.
Original Mortgage
$181,555
Interest Rate
5.5%
Mortgage Type
FHA
Purchase Details
Closed on
Mar 9, 2010
Sold by
Deutsch Bank National Trust Co
Bought by
Mittanck Properties Llc
Home Financials for this Owner
Home Financials are based on the most recent Mortgage that was taken out on this home.
Original Mortgage
$150,000
Interest Rate
5%
Mortgage Type
Purchase Money Mortgage
Purchase Details
Closed on
Oct 25, 2006
Sold by
Fuller Mark H and Fuller Michelle
Bought by
Osborne Kenneth and Osborne Kimberly
Home Financials for this Owner
Home Financials are based on the most recent Mortgage that was taken out on this home.
Original Mortgage
$200,000
Interest Rate
10.45%
Mortgage Type
Adjustable Rate Mortgage/ARM
Create a Home Valuation Report for This Property
The Home Valuation Report is an in-depth analysis detailing your home's value as well as a comparison with similar homes in the area
Home Values in the Area
Average Home Value in this Area
Purchase History
| Date | Buyer | Sale Price | Title Company |
|---|---|---|---|
| Livingston Emilee A | -- | None Listed On Document | |
| Livingston Randall C | -- | -- | |
| Mittanck Properties Llc | -- | -- | |
| Osborne Kenneth | -- | -- |
Source: Public Records
Mortgage History
| Date | Status | Borrower | Loan Amount |
|---|---|---|---|
| Previous Owner | Livingston Randall C | $181,555 | |
| Previous Owner | Mittanck Properties Llc | $150,000 | |
| Previous Owner | Osborne Kenneth | $200,000 |
Source: Public Records
Tax History Compared to Growth
Tax History
| Year | Tax Paid | Tax Assessment Tax Assessment Total Assessment is a certain percentage of the fair market value that is determined by local assessors to be the total taxable value of land and additions on the property. | Land | Improvement |
|---|---|---|---|---|
| 2024 | $1,355 | $154,508 | $14,616 | $139,892 |
| 2023 | $1,323 | $132,665 | $14,616 | $118,049 |
| 2022 | $1,226 | $116,399 | $22,000 | $94,399 |
| 2021 | $1,225 | $95,378 | $19,250 | $76,128 |
| 2020 | $1,195 | $95,378 | $19,250 | $76,128 |
| 2019 | $1,147 | $90,398 | $19,250 | $71,148 |
| 2018 | $1,103 | $87,010 | $19,250 | $67,760 |
| 2017 | $11 | $90,095 | $19,250 | $70,845 |
| 2016 | $1,159 | $100,401 | $19,250 | $81,151 |
| 2015 | $1,070 | $100,401 | $19,250 | $81,151 |
| 2014 | $1,054 | $100,401 | $19,250 | $81,151 |
| 2013 | $1,077 | $100,401 | $19,250 | $81,151 |
Source: Public Records
Map
Nearby Homes
- 1620 W 750 N
- 521 N 2400 W
- 1917 W 1500 N
- 2215 W 1500 N
- 2690 W 500 N
- 526 N 1380 W Unit 6
- 1647 N 1500 W
- 2396 W 1500 N
- 50 S 1500 W Unit 20
- 50 S 1500 W Unit 113
- 50 S 1500 W Unit 29
- 50 S 1500 W Unit 105
- 50 S 1500 W Unit 8
- 50 S 1500 W Unit 17
- 1350 W 150 N Unit 21
- 1350 W 150 N Unit 22
- 242 N 1200 W
- 2993 W 1500 N
- 1601 W 300 S Unit 57
- 1348 W 200 S