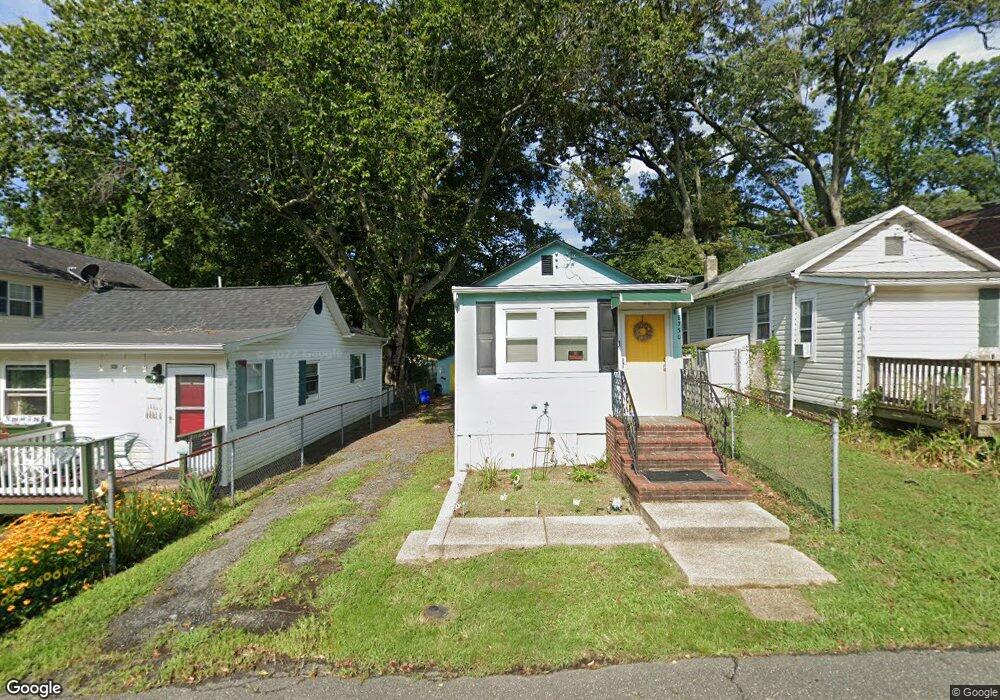
8730 E St Chesapeake Beach, MD 20732
Estimated Value: $305,592 - $399,000
Studio
2
Baths
1,330
Sq Ft
$263/Sq Ft
Est. Value
About This Home
This home is located at 8730 E St, Chesapeake Beach, MD 20732 and is currently estimated at $349,148, approximately $262 per square foot. 8730 E St is a home located in Calvert County with nearby schools including Windy Hill Elementary School, Windy Hill Middle School, and Northern High School.
Ownership History
Date
Name
Owned For
Owner Type
Purchase Details
Closed on
Jun 25, 2020
Sold by
Belliotti Anthony E and Belliotti Emelinda L
Bought by
Belliotti Emelinda L
Current Estimated Value
Purchase Details
Closed on
Sep 7, 1982
Sold by
Stewart Samuel W and Stewart Wilhelmina
Bought by
Belliotti Anthony E
Home Financials for this Owner
Home Financials are based on the most recent Mortgage that was taken out on this home.
Original Mortgage
$38,240
Interest Rate
15.59%
Create a Home Valuation Report for This Property
The Home Valuation Report is an in-depth analysis detailing your home's value as well as a comparison with similar homes in the area
Home Values in the Area
Average Home Value in this Area
Purchase History
| Date | Buyer | Sale Price | Title Company |
|---|---|---|---|
| Belliotti Emelinda L | -- | None Available | |
| Belliotti Anthony E | $46,000 | -- |
Source: Public Records
Mortgage History
| Date | Status | Borrower | Loan Amount |
|---|---|---|---|
| Closed | Belliotti Anthony E | $38,240 |
Source: Public Records
Tax History
| Year | Tax Paid | Tax Assessment Tax Assessment Total Assessment is a certain percentage of the fair market value that is determined by local assessors to be the total taxable value of land and additions on the property. | Land | Improvement |
|---|---|---|---|---|
| 2025 | $2,704 | $244,300 | $150,400 | $93,900 |
| 2024 | $2,622 | $236,833 | $0 | $0 |
| 2023 | $2,449 | $229,367 | $0 | $0 |
| 2022 | $2,412 | $221,900 | $150,400 | $71,500 |
| 2021 | $4,824 | $220,200 | $0 | $0 |
| 2020 | $2,281 | $218,500 | $0 | $0 |
| 2019 | $2,423 | $216,800 | $150,400 | $66,400 |
| 2018 | $2,421 | $216,800 | $150,400 | $66,400 |
| 2017 | $2,463 | $216,800 | $0 | $0 |
| 2016 | -- | $218,200 | $0 | $0 |
| 2015 | -- | $218,100 | $0 | $0 |
| 2014 | $2,375 | $218,000 | $0 | $0 |
Source: Public Records
Map
Nearby Homes
- 8832 Dayton Ave
- 3905 2nd St
- 8913 Dayton Ave
- 8605 Addison Bridge Place
- 3617 30th St
- 9000 Frederick Ave
- 8501 Bayside Rd
- 8501 Bayside Rd
- 3709 29th St
- 8401 F St
- 8328 D St
- 9000 Bay Ave Unit 401 & 402
- 8349 Bay Crest Ct
- 3800 28th St
- 3645 Bedford Dr
- 3713 28th St
- 9101 Greenwood Ave
- 3820 5th St
- 8236 Bayside Rd
- 4041 7th St
Your Personal Tour Guide
Ask me questions while you tour the home.