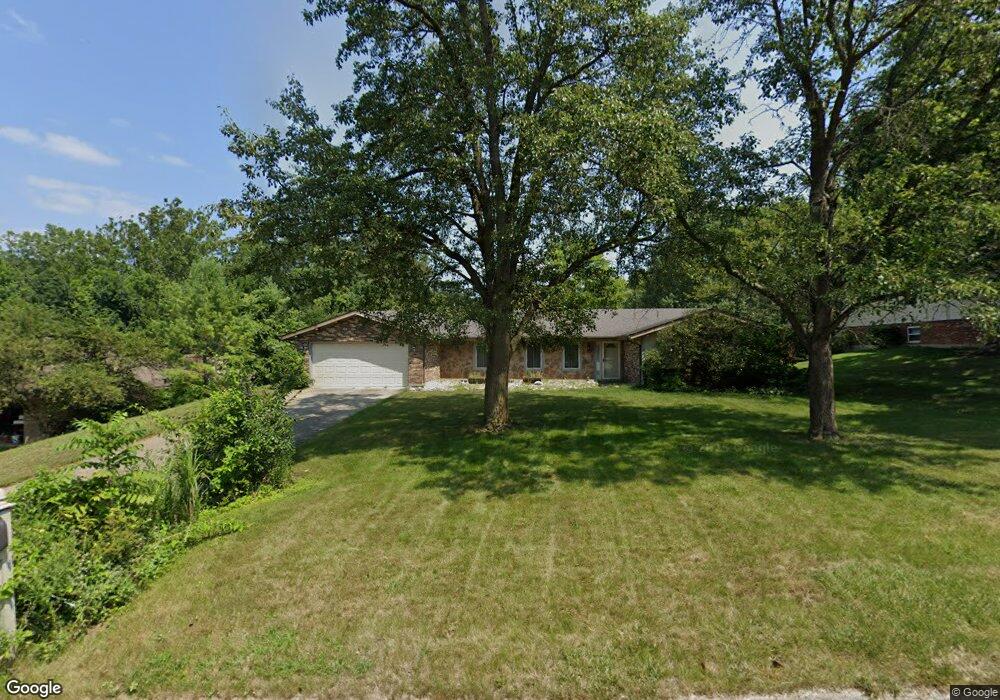
8730 Park Haven Point Dayton, OH 45458
Estimated Value: $329,000 - $381,000
4
Beds
3
Baths
2,550
Sq Ft
$142/Sq Ft
Est. Value
About This Home
This home is located at 8730 Park Haven Point, Dayton, OH 45458 and is currently estimated at $362,012, approximately $141 per square foot. 8730 Park Haven Point is a home located in Montgomery County with nearby schools including Primary Village South, Cline Elementary, and Tower Heights Middle School.
Ownership History
Date
Name
Owned For
Owner Type
Purchase Details
Closed on
Sep 6, 2023
Sold by
Cimbalista Michael D
Bought by
Nguyen Thuy Ngoc and Phan Duy Nhat
Current Estimated Value
Home Financials for this Owner
Home Financials are based on the most recent Mortgage that was taken out on this home.
Original Mortgage
$240,100
Outstanding Balance
$235,130
Interest Rate
7.09%
Mortgage Type
New Conventional
Estimated Equity
$126,882
Purchase Details
Closed on
May 15, 2012
Sold by
Hierholzer James C and Hierholzer Beverly K
Bought by
Cimbalista Michael D
Home Financials for this Owner
Home Financials are based on the most recent Mortgage that was taken out on this home.
Original Mortgage
$164,025
Interest Rate
4%
Mortgage Type
VA
Purchase Details
Closed on
Jun 7, 2006
Sold by
Mahrt Michael A and Mahrt Marilyn A
Bought by
Hierholzer James C and Hierholzer Beverly K
Purchase Details
Closed on
Sep 17, 1999
Sold by
Danishek Charles E and Danishek Crystal L
Bought by
Mahrt Michael A and Mahrt Marilyn A
Create a Home Valuation Report for This Property
The Home Valuation Report is an in-depth analysis detailing your home's value as well as a comparison with similar homes in the area
Home Values in the Area
Average Home Value in this Area
Purchase History
| Date | Buyer | Sale Price | Title Company |
|---|---|---|---|
| Nguyen Thuy Ngoc | $343,000 | Landmark Title | |
| Cimbalista Michael D | $180,000 | None Available | |
| Hierholzer James C | $199,000 | First American Title Ins Co | |
| Mahrt Michael A | $161,300 | Landmark Title Agency Inc |
Source: Public Records
Mortgage History
| Date | Status | Borrower | Loan Amount |
|---|---|---|---|
| Open | Nguyen Thuy Ngoc | $240,100 | |
| Previous Owner | Cimbalista Michael D | $164,025 |
Source: Public Records
Tax History Compared to Growth
Tax History
| Year | Tax Paid | Tax Assessment Tax Assessment Total Assessment is a certain percentage of the fair market value that is determined by local assessors to be the total taxable value of land and additions on the property. | Land | Improvement |
|---|---|---|---|---|
| 2024 | $5,649 | $91,620 | $18,760 | $72,860 |
| 2023 | $5,649 | $91,620 | $18,760 | $72,860 |
| 2022 | $5,330 | $68,380 | $14,000 | $54,380 |
| 2021 | $5,345 | $68,380 | $14,000 | $54,380 |
| 2020 | $5,337 | $68,380 | $14,000 | $54,380 |
| 2019 | $5,792 | $66,330 | $14,000 | $52,330 |
| 2018 | $5,173 | $66,330 | $14,000 | $52,330 |
| 2017 | $5,118 | $66,330 | $14,000 | $52,330 |
| 2016 | $4,662 | $56,940 | $14,000 | $42,940 |
| 2015 | $4,587 | $56,940 | $14,000 | $42,940 |
| 2014 | $4,587 | $56,940 | $14,000 | $42,940 |
| 2012 | -- | $58,020 | $14,000 | $44,020 |
Source: Public Records
Map
Nearby Homes
- 2006 Washington Creek Ln
- 2044 Meadowside Ln
- 9258 Clyo Rd
- 8580 Hide a Way Ln
- 9424 Clyo Rd
- 9038 Woodstream Ln
- 9101 Rooks Rd
- 8754 Elysee Cir
- 0 Rooks Rd
- 2780 E Spring Valley Pike
- 9354 Buckboard Dr
- 9139 Indian Springs Ct
- 2037 Stablehand Dr
- 8730 Dowd Ct
- 9863 Fairwater Springs Dr
- 5018 Alpine Rose Ct
- 1947 Horseshoe Bend
- 1943 Horseshoe Bend
- 1620 Ambridge Rd
- 8977 Slagle Rd
- 8740 Park Haven Point
- 8720 Park Haven Point
- 8721 Centerridge Point
- 8731 Centerridge Point
- 8750 Park Haven Point
- 8711 Centerridge Point
- 8710 Park Haven Point
- 8731 Park Haven Point
- 8721 Park Haven Point
- 8741 Park Haven Point
- 8741 Centerridge Point
- 8751 Park Haven Point
- 8711 Park Haven Point
- 8700 Centerridge Point
- 8760 Park Haven Point
- 8700 Park Haven Point
- 2221 Mill Trace Ln
- 8701 Park Haven Point
- 2111 Mill Trace Ln
- 8720 Centerridge Point