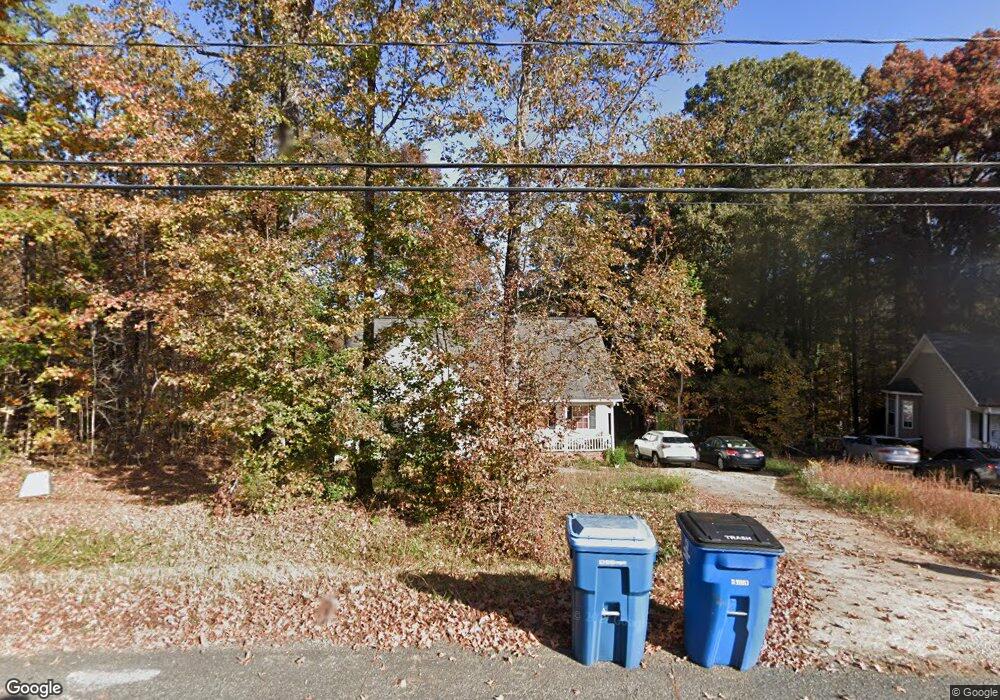
8736 Vagabond Rd Charlotte, NC 28227
Estimated Value: $339,000 - $430,000
4
Beds
3
Baths
1,697
Sq Ft
$227/Sq Ft
Est. Value
About This Home
This home is located at 8736 Vagabond Rd, Charlotte, NC 28227 and is currently estimated at $386,059, approximately $227 per square foot. 8736 Vagabond Rd is a home located in Mecklenburg County with nearby schools including Clear Creek Elementary, Northeast Middle, and Independence High.
Ownership History
Date
Name
Owned For
Owner Type
Purchase Details
Closed on
Dec 23, 2010
Sold by
Arrowood Charles Wesley and Arrowood Betty Ross
Bought by
Arrowood Charles Wesley and Arrowood Betty Ross
Current Estimated Value
Purchase Details
Closed on
Nov 25, 2008
Sold by
Bigley Darren J and Bigley Jennifer A
Bought by
Beall Jennifer M and Beall John E
Home Financials for this Owner
Home Financials are based on the most recent Mortgage that was taken out on this home.
Original Mortgage
$146,664
Outstanding Balance
$95,764
Interest Rate
5.89%
Mortgage Type
FHA
Estimated Equity
$290,295
Purchase Details
Closed on
Apr 17, 2003
Sold by
Arrowood Charles W and Arrowood Betty R
Bought by
Bigley Darren J and Bigley Jennifer A
Home Financials for this Owner
Home Financials are based on the most recent Mortgage that was taken out on this home.
Original Mortgage
$146,442
Interest Rate
5.62%
Mortgage Type
VA
Create a Home Valuation Report for This Property
The Home Valuation Report is an in-depth analysis detailing your home's value as well as a comparison with similar homes in the area
Home Values in the Area
Average Home Value in this Area
Purchase History
| Date | Buyer | Sale Price | Title Company |
|---|---|---|---|
| Arrowood Charles Wesley | -- | None Available | |
| Beall Jennifer M | $149,000 | Investors Title Insurance Co | |
| Bigley Darren J | $150,000 | -- |
Source: Public Records
Mortgage History
| Date | Status | Borrower | Loan Amount |
|---|---|---|---|
| Open | Beall Jennifer M | $146,664 | |
| Previous Owner | Bigley Darren J | $146,442 |
Source: Public Records
Tax History Compared to Growth
Tax History
| Year | Tax Paid | Tax Assessment Tax Assessment Total Assessment is a certain percentage of the fair market value that is determined by local assessors to be the total taxable value of land and additions on the property. | Land | Improvement |
|---|---|---|---|---|
| 2025 | $2,172 | $321,600 | $65,000 | $256,600 |
| 2024 | $2,172 | $321,600 | $65,000 | $256,600 |
| 2023 | $2,135 | $321,600 | $65,000 | $256,600 |
| 2022 | $1,664 | $191,600 | $35,000 | $156,600 |
| 2021 | $1,664 | $191,600 | $35,000 | $156,600 |
| 2020 | $1,654 | $191,600 | $35,000 | $156,600 |
| 2019 | $1,648 | $191,600 | $35,000 | $156,600 |
| 2018 | $1,748 | $153,900 | $30,000 | $123,900 |
| 2017 | $1,733 | $153,900 | $30,000 | $123,900 |
| 2016 | $1,724 | $153,900 | $30,000 | $123,900 |
| 2015 | $1,705 | $153,900 | $30,000 | $123,900 |
| 2014 | $1,676 | $153,900 | $30,000 | $123,900 |
Source: Public Records
Map
Nearby Homes
- 8714 Vagabond Rd
- 10624 Wood Meadow Dr
- 10314 Buccaneer Rd
- 11125 Dappled Light Trail
- 14006 Autumn Glory Dr
- 14002 Autumn Glory Dr
- 9027 Leah Meadow Ln Unit 23
- 8402 Aspen Ct
- 8521 Aspen Ct
- 8222 Aspen Ct
- 8214 Aspen Ct
- 9523 Bales Ln Unit 8
- 8137 Caliterra Dr
- 9209 Arlington Hills Dr
- 9711 Arlington Oaks Dr
- 9721 Arlington Oaks Dr
- 7901 Wilson Ridge Ln
- 8011 Caliterra Dr
- 15312 Sharpe Rd
- 9921 Hanging Moss Trail
- 8726 Vagabond Rd
- TBD Vagabond Rd
- 8720 Vagabond Rd
- 8725 Vagabond Rd
- 8800 Vagabond Rd
- 10608 Russet Place
- 10605 Russet Place
- 8801 Vagabond Rd
- 8541 Clear Meadow Ln
- 10530 Russet Place
- 8808 Vagabond Rd
- 8706 Vagabond Rd
- 8805 Vagabond Rd
- 8705 Vagabond Rd
- 10315 Beckley Place
- 8640 Vagabond Rd
- 10314 Beckley Place
- 8816 Vagabond Rd
- 10509 Russet Place
- 10311 Beckley Place