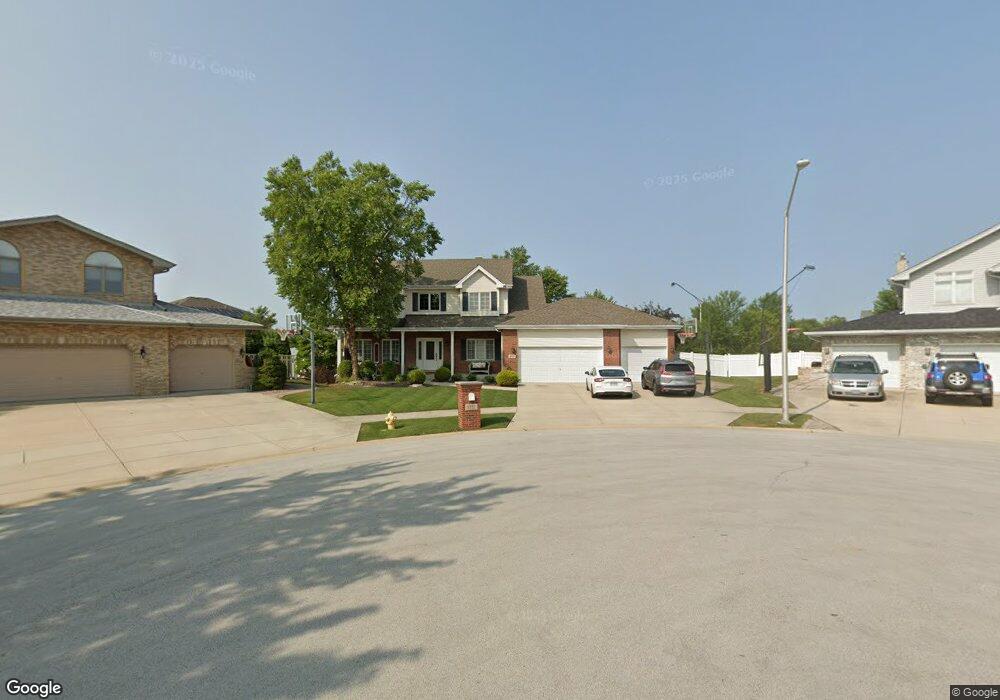
8737 Moss Ct Unit 4 Tinley Park, IL 60487
Central Tinley Park NeighborhoodEstimated Value: $559,000 - $586,000
4
Beds
3
Baths
2,663
Sq Ft
$215/Sq Ft
Est. Value
About This Home
This home is located at 8737 Moss Ct Unit 4, Tinley Park, IL 60487 and is currently estimated at $571,467, approximately $214 per square foot. 8737 Moss Ct Unit 4 is a home located in Cook County with nearby schools including Millennium Elementary School, Prairie View Middle School, and Victor J Andrew High School.
Ownership History
Date
Name
Owned For
Owner Type
Purchase Details
Closed on
Apr 22, 2023
Sold by
Boss Michael W and Boss Cheryl A
Bought by
Michael W Boss & Cheryl A Boss Living Trust
Current Estimated Value
Purchase Details
Closed on
Jun 8, 2004
Sold by
Standard Bank & Trust Co
Bought by
Boss Michael W and Boss Cheryl A
Home Financials for this Owner
Home Financials are based on the most recent Mortgage that was taken out on this home.
Original Mortgage
$298,083
Interest Rate
6.42%
Mortgage Type
Unknown
Create a Home Valuation Report for This Property
The Home Valuation Report is an in-depth analysis detailing your home's value as well as a comparison with similar homes in the area
Home Values in the Area
Average Home Value in this Area
Purchase History
| Date | Buyer | Sale Price | Title Company |
|---|---|---|---|
| Michael W Boss & Cheryl A Boss Living Trust | -- | None Listed On Document | |
| Boss Michael W | $358,500 | Cti |
Source: Public Records
Mortgage History
| Date | Status | Borrower | Loan Amount |
|---|---|---|---|
| Previous Owner | Boss Michael W | $298,083 |
Source: Public Records
Tax History Compared to Growth
Tax History
| Year | Tax Paid | Tax Assessment Tax Assessment Total Assessment is a certain percentage of the fair market value that is determined by local assessors to be the total taxable value of land and additions on the property. | Land | Improvement |
|---|---|---|---|---|
| 2024 | $11,851 | $41,709 | $10,977 | $30,732 |
| 2023 | $11,224 | $46,000 | $10,977 | $35,023 |
| 2022 | $11,224 | $34,905 | $9,545 | $25,360 |
| 2021 | $10,894 | $34,904 | $9,545 | $25,359 |
| 2020 | $10,688 | $34,904 | $9,545 | $25,359 |
| 2019 | $10,578 | $36,046 | $8,590 | $27,456 |
| 2018 | $10,350 | $36,046 | $8,590 | $27,456 |
| 2017 | $10,093 | $36,046 | $8,590 | $27,456 |
| 2016 | $9,231 | $30,292 | $7,636 | $22,656 |
| 2015 | $9,091 | $30,292 | $7,636 | $22,656 |
| 2014 | $10,013 | $33,307 | $7,636 | $25,671 |
| 2013 | $9,024 | $32,508 | $7,636 | $24,872 |
Source: Public Records
Map
Nearby Homes
- 17631 Dover Ct
- 8530 Radcliffe Rd
- Eden Plan at Radcliffe Place
- Fremont Plan at Radcliffe Place
- Danbury Plan at Radcliffe Place
- Calysta Plan at Radcliffe Place
- Briarcliffe Plan at Radcliffe Place
- Amberwood Plan at Radcliffe Place
- 17418 Avon Ln
- 17533 Pecan Ln
- 8416 Stratford Dr Unit 8416
- 8423 Stratford Dr Unit 8423
- 17324 Humber Ln
- 9058 Newcastle Ct
- 18261 Kirby Dr Unit 2918261
- 9038 Mansfield Dr Unit 8
- 17594 Windsor Pkwy Unit 58
- 17964 Upland Dr
- 9313 178th St
- 9201 175th St