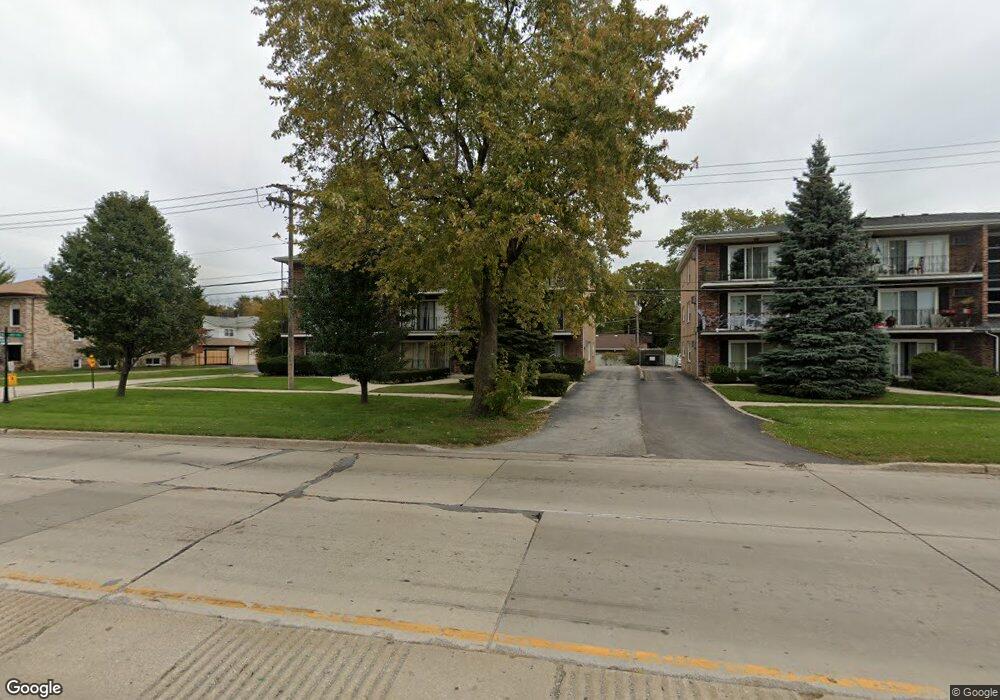
8739 S Roberts Rd Unit 2S Hickory Hills, IL 60457
Estimated Value: $125,000 - $263,000
2
Beds
--
Bath
7,560
Sq Ft
$24/Sq Ft
Est. Value
About This Home
This home is located at 8739 S Roberts Rd Unit 2S, Hickory Hills, IL 60457 and is currently estimated at $183,249, approximately $24 per square foot. 8739 S Roberts Rd Unit 2S is a home located in Cook County with nearby schools including Dorn Elementary School, Glen Oaks Elementary School, and H H Conrady Jr High School.
Ownership History
Date
Name
Owned For
Owner Type
Purchase Details
Closed on
Jun 16, 2006
Sold by
Len Renata
Bought by
Komperda Maria and Komperda Agnieszka
Current Estimated Value
Home Financials for this Owner
Home Financials are based on the most recent Mortgage that was taken out on this home.
Original Mortgage
$110,500
Outstanding Balance
$65,509
Interest Rate
6.72%
Mortgage Type
Unknown
Estimated Equity
$117,740
Purchase Details
Closed on
Aug 6, 2003
Sold by
Ogiela Jozef
Bought by
Len Renata
Home Financials for this Owner
Home Financials are based on the most recent Mortgage that was taken out on this home.
Original Mortgage
$82,650
Interest Rate
5%
Mortgage Type
Unknown
Purchase Details
Closed on
Aug 23, 1999
Sold by
Browne Thomas and Browne Margaret
Bought by
Ogiela Jozef and Ogiela Helena
Home Financials for this Owner
Home Financials are based on the most recent Mortgage that was taken out on this home.
Original Mortgage
$120,000
Interest Rate
7.9%
Mortgage Type
Stand Alone First
Create a Home Valuation Report for This Property
The Home Valuation Report is an in-depth analysis detailing your home's value as well as a comparison with similar homes in the area
Home Values in the Area
Average Home Value in this Area
Purchase History
| Date | Buyer | Sale Price | Title Company |
|---|---|---|---|
| Komperda Maria | $145,500 | Cti | |
| Len Renata | $87,000 | Cti | |
| Ogiela Jozef | $245,000 | -- |
Source: Public Records
Mortgage History
| Date | Status | Borrower | Loan Amount |
|---|---|---|---|
| Open | Komperda Maria | $110,500 | |
| Previous Owner | Len Renata | $82,650 | |
| Previous Owner | Ogiela Jozef | $120,000 |
Source: Public Records
Tax History Compared to Growth
Tax History
| Year | Tax Paid | Tax Assessment Tax Assessment Total Assessment is a certain percentage of the fair market value that is determined by local assessors to be the total taxable value of land and additions on the property. | Land | Improvement |
|---|---|---|---|---|
| 2024 | $363 | $8,603 | $914 | $7,689 |
| 2023 | $207 | $8,602 | $913 | $7,689 |
| 2022 | $207 | $7,386 | $1,180 | $6,206 |
| 2021 | $262 | $7,385 | $1,179 | $6,206 |
| 2020 | $1,513 | $7,385 | $1,179 | $6,206 |
| 2019 | $1,848 | $8,652 | $1,065 | $7,587 |
| 2018 | $1,805 | $8,652 | $1,065 | $7,587 |
| 2017 | $1,758 | $8,652 | $1,065 | $7,587 |
| 2016 | $1,430 | $6,472 | $913 | $5,559 |
| 2015 | $1,358 | $6,472 | $913 | $5,559 |
| 2014 | $1,359 | $6,472 | $913 | $5,559 |
| 2013 | $2,222 | $9,454 | $913 | $8,541 |
Source: Public Records
Map
Nearby Homes
- 8901 S Roberts Rd Unit 104
- 8545 S Roberts Rd
- 8518 S 79th Ct
- 9051 S Roberts Rd Unit 102
- 9003 Milford Ct
- 8302 W 87th St
- 8543 S 83rd Ave
- 8564 S 83rd Ave
- 8931 S 83rd Ct
- 8059 W 84th St Unit 3N
- 8410 S 78th Ave
- 8400 W 87th St
- 8332 S 78th Ct
- 8462 S 83rd Ave
- 8800 S Harlem Ave Unit 2111
- 8800 S Harlem Ave Unit 925
- 8800 S Harlem Ave Unit 15
- 8800 S Harlem Ave Unit 2366
- 8800 S Harlem Ave Unit 2311
- 8800 S Harlem Ave
- 8739 S Roberts Rd Unit 1S
- 8739 S Roberts Rd Unit 3S
- 8739 S Roberts Rd Unit 2
- 8745 S Roberts Rd Unit 9
- 8745 S Roberts Rd Unit 1CENTER
- 8743 S Roberts Rd Unit 2-NORTH
- 8743 S Roberts Rd Unit 2S
- 8743 S Roberts Rd Unit 3C
- 8743 S Roberts Rd Unit 2C
- 8743 S Roberts Rd Unit 1
- 8743 S Roberts Rd Unit 1CENTER
- 8743 S Roberts Rd Unit 1N
- 8735 S Roberts Rd Unit 3C
- 8735 S Roberts Rd Unit 1C
- 8735 S Roberts Rd Unit 3N
- 8735 S Roberts Rd Unit 2N
- 8735 S Roberts Rd Unit 1N
- 8735 S Roberts Rd Unit 2C
- 8735 S Roberts Rd Unit 1
- 7949 W 87th Place