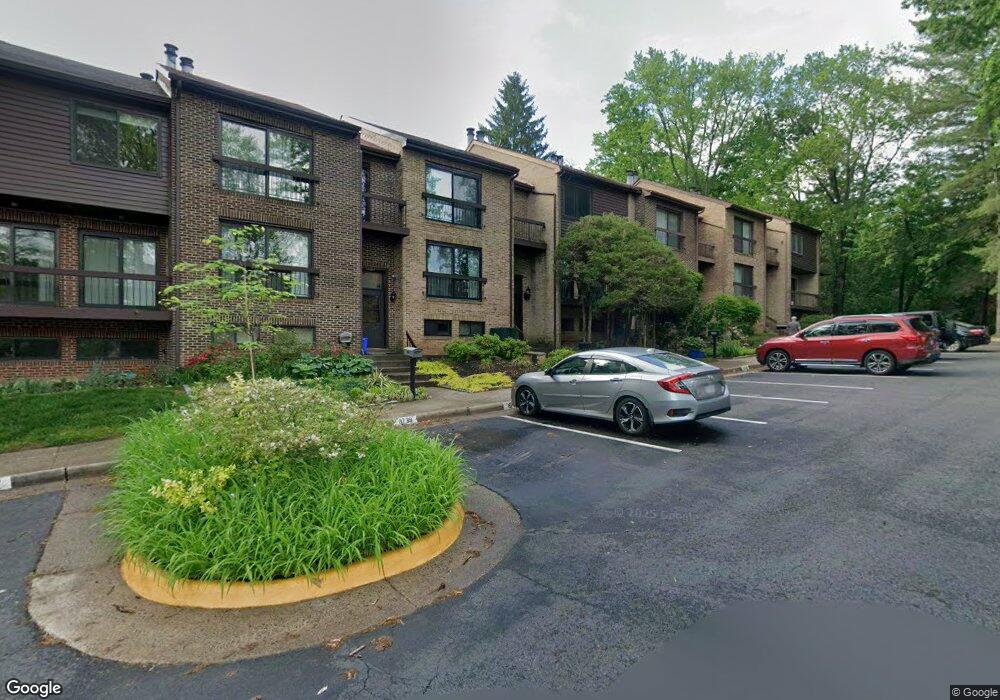
8739 Sheridan Farms Ct Springfield, VA 22152
Estimated Value: $617,000 - $629,000
3
Beds
4
Baths
1,624
Sq Ft
$383/Sq Ft
Est. Value
About This Home
This home is located at 8739 Sheridan Farms Ct, Springfield, VA 22152 and is currently estimated at $621,406, approximately $382 per square foot. 8739 Sheridan Farms Ct is a home located in Fairfax County with nearby schools including Rolling Valley Elementary School, Irving Middle School, and West Springfield High School.
Ownership History
Date
Name
Owned For
Owner Type
Purchase Details
Closed on
Jan 23, 2015
Sold by
Sibal Melissa Y
Bought by
Sibal Melissa Y
Current Estimated Value
Home Financials for this Owner
Home Financials are based on the most recent Mortgage that was taken out on this home.
Original Mortgage
$303,250
Outstanding Balance
$171,527
Interest Rate
4%
Mortgage Type
New Conventional
Estimated Equity
$449,879
Purchase Details
Closed on
May 5, 2003
Sold by
Ripa David L
Bought by
Sibal Maryanne
Home Financials for this Owner
Home Financials are based on the most recent Mortgage that was taken out on this home.
Original Mortgage
$283,250
Interest Rate
5.82%
Mortgage Type
New Conventional
Purchase Details
Closed on
Mar 28, 1997
Sold by
Kushnick + Michael G
Bought by
Ripa Tammy E N and Ripa David L
Home Financials for this Owner
Home Financials are based on the most recent Mortgage that was taken out on this home.
Original Mortgage
$147,798
Interest Rate
7.59%
Mortgage Type
New Conventional
Create a Home Valuation Report for This Property
The Home Valuation Report is an in-depth analysis detailing your home's value as well as a comparison with similar homes in the area
Home Values in the Area
Average Home Value in this Area
Purchase History
| Date | Buyer | Sale Price | Title Company |
|---|---|---|---|
| Sibal Melissa Y | -- | -- | |
| Sibal Maryanne | $275,000 | -- | |
| Ripa Tammy E N | $144,900 | -- |
Source: Public Records
Mortgage History
| Date | Status | Borrower | Loan Amount |
|---|---|---|---|
| Open | Sibal Melissa Y | $303,250 | |
| Previous Owner | Ripa Tammy E N | $283,250 | |
| Previous Owner | Ripa Tammy E N | $147,798 |
Source: Public Records
Tax History Compared to Growth
Tax History
| Year | Tax Paid | Tax Assessment Tax Assessment Total Assessment is a certain percentage of the fair market value that is determined by local assessors to be the total taxable value of land and additions on the property. | Land | Improvement |
|---|---|---|---|---|
| 2025 | $6,027 | $577,470 | $170,000 | $407,470 |
| 2024 | $6,027 | $520,200 | $150,000 | $370,200 |
| 2023 | $5,553 | $492,110 | $150,000 | $342,110 |
| 2022 | $5,569 | $487,020 | $150,000 | $337,020 |
| 2021 | $4,887 | $416,470 | $120,000 | $296,470 |
| 2020 | $4,938 | $417,270 | $120,000 | $297,270 |
| 2019 | $4,938 | $417,270 | $120,000 | $297,270 |
| 2018 | $4,625 | $402,130 | $115,000 | $287,130 |
| 2017 | $4,391 | $378,200 | $105,000 | $273,200 |
| 2016 | $4,513 | $389,560 | $105,000 | $284,560 |
| 2015 | $4,347 | $389,560 | $105,000 | $284,560 |
| 2014 | $4,085 | $366,850 | $103,000 | $263,850 |
Source: Public Records
Map
Nearby Homes
- 6403 Velliety Ln
- 6410 Wyngate Dr
- 6465 Blarney Stone Ct
- 6606 Huntsman Blvd
- 6163 Forest Creek Ln
- 6614 Grey Fox Dr
- 6427 Old Scotts Ct
- 8674 Center Rd Unit 1
- 6260 Rathlin Dr
- 6143 Green Hollow Ct
- 8444 Millwood Dr
- 9136 Oshad Ln
- 6710 Red Jacket Rd
- 8590 Beatrice Ct
- 6801 Houndmaster Rd
- 6500 Rivington Rd
- 6355 Regal Oak Dr
- 6010 Timber Hollow Ln
- 6311 Fenestra Ct Unit 137B
- 9175 Broken Oak Place Unit 39B
- 8741 Sheridan Farms Ct
- 8737 Sheridan Farms Ct
- 8743 Sheridan Farms Ct
- 8745 Sheridan Farms Ct
- 8811 Surveyors Place
- 8809 Surveyors Place
- 8813 Surveyors Place
- 8747 Sheridan Farms Ct
- 8815 Surveyors Place
- 8817 Surveyors Place
- 8735 Sheridan Farms Ct
- 8819 Surveyors Place
- 8749 Sheridan Farms Ct
- 8733 Sheridan Farms Ct
- 8821 Surveyors Place
- 8708 Sheridan Farms Ct
- 8706 Sheridan Farms Ct
- 8731 Sheridan Farms Ct
- 8704 Sheridan Farms Ct
- 8800 Surveyors Place