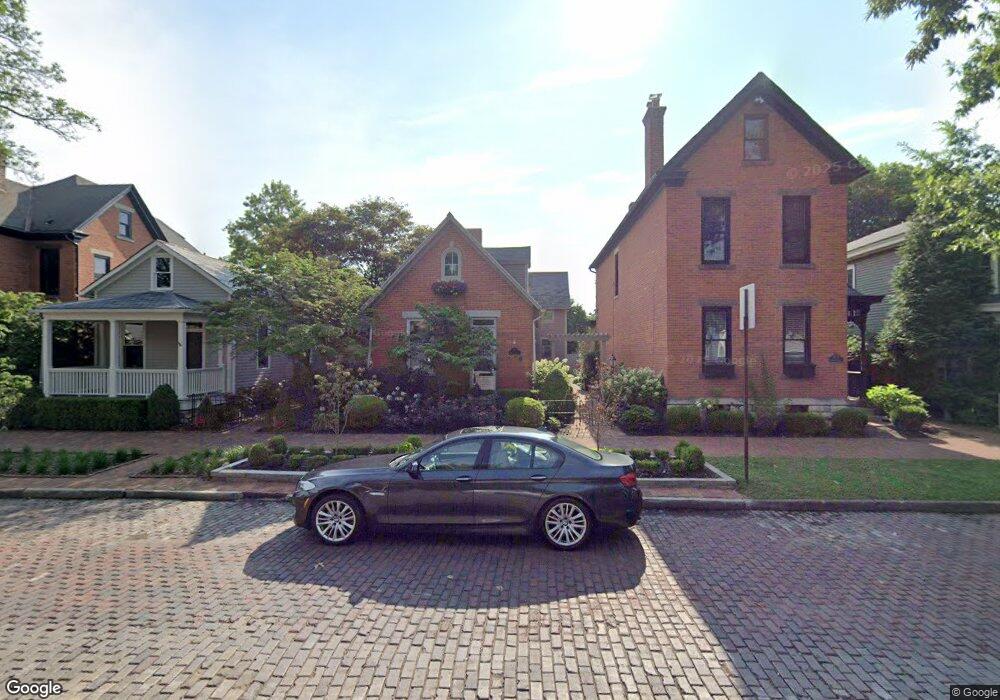
874 Mohawk St Columbus, OH 43206
German Village NeighborhoodEstimated Value: $891,000 - $1,288,000
3
Beds
2
Baths
2,559
Sq Ft
$396/Sq Ft
Est. Value
About This Home
This home is located at 874 Mohawk St, Columbus, OH 43206 and is currently estimated at $1,013,611, approximately $396 per square foot. 874 Mohawk St is a home located in Franklin County with nearby schools including Siebert Elementary School, South High School, and South Columbus Preparatory Academy.
Ownership History
Date
Name
Owned For
Owner Type
Purchase Details
Closed on
Oct 26, 2010
Sold by
Pettit Richard L and Pettit Sharon A
Bought by
Billet Isabelle M
Current Estimated Value
Home Financials for this Owner
Home Financials are based on the most recent Mortgage that was taken out on this home.
Original Mortgage
$275,000
Interest Rate
3.72%
Mortgage Type
New Conventional
Purchase Details
Closed on
Apr 26, 2001
Sold by
Cleary Michael P and Estate Of Marian Karn
Bought by
Pettit Richard L and Pettit Sharon A
Home Financials for this Owner
Home Financials are based on the most recent Mortgage that was taken out on this home.
Original Mortgage
$160,000
Interest Rate
7.03%
Purchase Details
Closed on
Jul 20, 1964
Bought by
Karn Marian
Create a Home Valuation Report for This Property
The Home Valuation Report is an in-depth analysis detailing your home's value as well as a comparison with similar homes in the area
Home Values in the Area
Average Home Value in this Area
Purchase History
| Date | Buyer | Sale Price | Title Company |
|---|---|---|---|
| Billet Isabelle M | $551,000 | Stewart Tit | |
| Pettit Richard L | $200,000 | Amerititle Agency Inc | |
| Karn Marian | -- | -- |
Source: Public Records
Mortgage History
| Date | Status | Borrower | Loan Amount |
|---|---|---|---|
| Closed | Billet Isabelle M | $275,000 | |
| Previous Owner | Pettit Richard L | $160,000 |
Source: Public Records
Tax History
| Year | Tax Paid | Tax Assessment Tax Assessment Total Assessment is a certain percentage of the fair market value that is determined by local assessors to be the total taxable value of land and additions on the property. | Land | Improvement |
|---|---|---|---|---|
| 2025 | $10,526 | $234,540 | $123,690 | $110,850 |
| 2024 | $10,526 | $234,540 | $123,690 | $110,850 |
| 2023 | $10,392 | $234,535 | $123,690 | $110,845 |
| 2022 | $11,075 | $213,540 | $54,920 | $158,620 |
| 2021 | $11,095 | $213,540 | $54,920 | $158,620 |
| 2020 | $11,109 | $213,540 | $54,920 | $158,620 |
| 2019 | $11,321 | $186,620 | $47,740 | $138,880 |
| 2018 | $11,460 | $186,620 | $47,740 | $138,880 |
| 2017 | $12,058 | $186,620 | $47,740 | $138,880 |
| 2016 | $12,803 | $193,270 | $38,150 | $155,120 |
| 2015 | $11,622 | $193,270 | $38,150 | $155,120 |
| 2014 | $11,650 | $193,270 | $38,150 | $155,120 |
| 2013 | $5,473 | $184,065 | $36,330 | $147,735 |
Source: Public Records
Map
Nearby Homes
- 243 E Whittier St Unit 245
- 136 E Whittier St
- 135 E Whittier St
- 253 E Kossuth St Unit 253-H
- 831 S Lazelle St
- 722 Mohawk St Unit 722
- 874 S High St
- 37 Stewart Ave
- 1010 Bruck St
- 717 S 3rd St
- 33 E Frankfort St
- 46 E Frankfort St
- 707 Sycamore Place Unit 707
- 242 E Sycamore St
- 955 S High St
- 10 - 20 E Deshler Ave
- 186 E Sycamore St
- 432 E Kossuth St
- 169 Thurman Ave Unit 169
- 995 S Wall St
- 878 Mohawk St
- 870 Mohawk St
- 866 Mohawk St
- 865 Macon Aly
- 862 Mohawk St
- 184 E Whittier St
- 170 E Whittier St
- 888 Mohawk St
- 186 E Whittier St
- 188 E Whittier St
- 188-190 E Whittier St
- 856 Mohawk St Unit 860
- 185 Lansing St
- 874 Macon Aly
- 860 Mohawk St
- 884 Macon Aly
- 866 Macon Aly
- 194 E Whittier St
- 886 Macon Aly Unit 888
- 886-888 Macon Aly
Your Personal Tour Guide
Ask me questions while you tour the home.