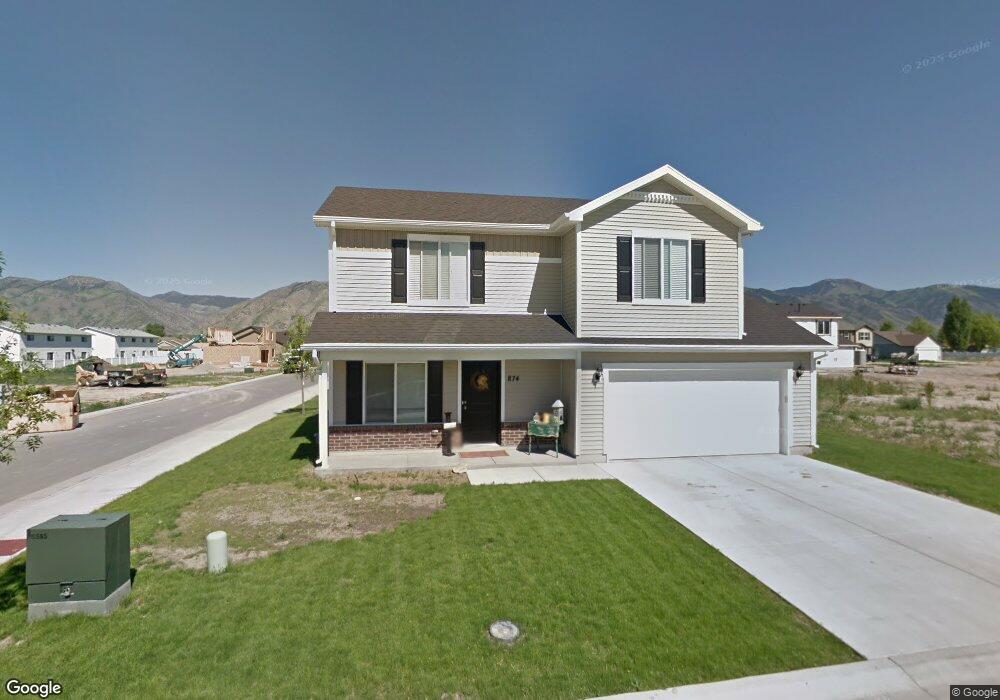
874 N 480 W Unit 75 Logan, UT 84321
Bridger NeighborhoodEstimated Value: $389,000 - $440,000
Studio
--
Bath
1,317
Sq Ft
$307/Sq Ft
Est. Value
About This Home
This home is located at 874 N 480 W Unit 75, Logan, UT 84321 and is currently estimated at $404,352, approximately $307 per square foot. 874 N 480 W Unit 75 is a home located in Cache County with nearby schools including Bridger School, Mount Logan Middle School, and Logan High School.
Ownership History
Date
Name
Owned For
Owner Type
Purchase Details
Closed on
Apr 16, 2021
Sold by
Stoker Mason R and Stoker Chelsie M
Bought by
Pioneer Reverse Exchange Lc
Current Estimated Value
Purchase Details
Closed on
Apr 30, 2015
Sold by
Jenkins Braden Thomas and Jenkins Kyler
Bought by
Stoker Mason R and Stoker Chelsie M
Home Financials for this Owner
Home Financials are based on the most recent Mortgage that was taken out on this home.
Original Mortgage
$151,765
Interest Rate
3.64%
Mortgage Type
FHA
Purchase Details
Closed on
Oct 4, 2012
Sold by
Ashbury Court Development 2 Llc
Bought by
Jenkins Braden Thomas and Jenkins Kyler
Home Financials for this Owner
Home Financials are based on the most recent Mortgage that was taken out on this home.
Original Mortgage
$150,237
Interest Rate
3.63%
Mortgage Type
VA
Create a Home Valuation Report for This Property
The Home Valuation Report is an in-depth analysis detailing your home's value as well as a comparison with similar homes in the area
Home Values in the Area
Average Home Value in this Area
Purchase History
| Date | Buyer | Sale Price | Title Company |
|---|---|---|---|
| Pioneer Reverse Exchange Lc | -- | American Secure Title Logan | |
| Stoker Mason R | -- | Cache Title | |
| Jenkins Braden Thomas | -- | Cache Title Company |
Source: Public Records
Mortgage History
| Date | Status | Borrower | Loan Amount |
|---|---|---|---|
| Previous Owner | Stoker Mason R | $151,765 | |
| Previous Owner | Jenkins Braden Thomas | $150,237 | |
| Closed | Pioneer Reverse Exchange Lc | $0 |
Source: Public Records
Tax History
| Year | Tax Paid | Tax Assessment Tax Assessment Total Assessment is a certain percentage of the fair market value that is determined by local assessors to be the total taxable value of land and additions on the property. | Land | Improvement |
|---|---|---|---|---|
| 2025 | $3,015 | $390,000 | $0 | $0 |
| 2024 | $3,113 | $390,000 | $0 | $0 |
| 2023 | $3,253 | $388,400 | $0 | $0 |
| 2022 | $3,484 | $388,400 | $0 | $0 |
| 2021 | $1,355 | $233,396 | $42,000 | $191,396 |
| 2020 | $1,345 | $208,432 | $42,000 | $166,432 |
| 2019 | $1,405 | $208,432 | $42,000 | $166,432 |
| 2018 | $1,407 | $190,600 | $42,000 | $148,600 |
| 2017 | $1,330 | $95,260 | $0 | $0 |
| 2016 | $1,379 | $83,655 | $0 | $0 |
| 2015 | $1,213 | $83,655 | $0 | $0 |
| 2014 | $1,096 | $83,655 | $0 | $0 |
| 2013 | -- | $83,655 | $0 | $0 |
Source: Public Records
Map
Nearby Homes
Your Personal Tour Guide
Ask me questions while you tour the home.