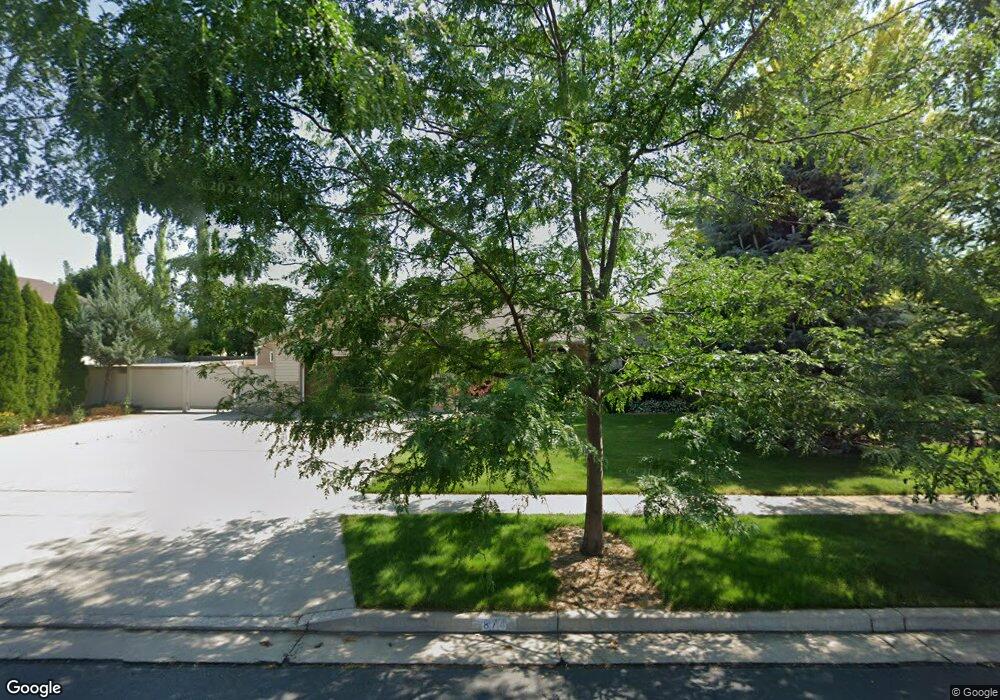
874 W 2770 S Nibley, UT 84321
Estimated Value: $417,254 - $447,000
4
Beds
2
Baths
1,574
Sq Ft
$274/Sq Ft
Est. Value
About This Home
This home is located at 874 W 2770 S, Nibley, UT 84321 and is currently estimated at $431,814, approximately $274 per square foot. 874 W 2770 S is a home located in Cache County with nearby schools including Nibley School, Spring Creek Middle School, and South Cache Middle School.
Ownership History
Date
Name
Owned For
Owner Type
Purchase Details
Closed on
Jul 15, 2015
Sold by
Greer Glenda
Bought by
Greer Glenda
Current Estimated Value
Purchase Details
Closed on
Mar 11, 2009
Sold by
Greer Glenda
Bought by
Greer Loren D and Greer Glenda
Home Financials for this Owner
Home Financials are based on the most recent Mortgage that was taken out on this home.
Original Mortgage
$103,500
Outstanding Balance
$64,895
Interest Rate
5.03%
Mortgage Type
New Conventional
Estimated Equity
$366,919
Purchase Details
Closed on
Jul 25, 2007
Sold by
Mcbride Brian J and Mcbride Alisha A
Bought by
Yost Jill and Yost Morgan Glenn
Home Financials for this Owner
Home Financials are based on the most recent Mortgage that was taken out on this home.
Original Mortgage
$151,200
Interest Rate
6.73%
Mortgage Type
New Conventional
Create a Home Valuation Report for This Property
The Home Valuation Report is an in-depth analysis detailing your home's value as well as a comparison with similar homes in the area
Home Values in the Area
Average Home Value in this Area
Purchase History
| Date | Buyer | Sale Price | Title Company |
|---|---|---|---|
| Greer Glenda | -- | None Available | |
| Greer Loren D | -- | American Secure Title | |
| Greer Glenda | -- | American Secure Title | |
| Yost Jill | -- | American Secure Title |
Source: Public Records
Mortgage History
| Date | Status | Borrower | Loan Amount |
|---|---|---|---|
| Open | Greer Glenda | $103,500 | |
| Previous Owner | Yost Jill | $151,200 |
Source: Public Records
Tax History Compared to Growth
Tax History
| Year | Tax Paid | Tax Assessment Tax Assessment Total Assessment is a certain percentage of the fair market value that is determined by local assessors to be the total taxable value of land and additions on the property. | Land | Improvement |
|---|---|---|---|---|
| 2025 | $1,632 | $216,390 | $0 | $0 |
| 2024 | $1,547 | $192,500 | $0 | $0 |
| 2023 | $1,622 | $189,005 | $0 | $0 |
| 2022 | $1,688 | $189,005 | $0 | $0 |
| 2021 | $1,656 | $287,915 | $65,000 | $222,915 |
| 2020 | $1,395 | $230,842 | $65,000 | $165,842 |
| 2019 | $1,463 | $230,841 | $65,000 | $165,841 |
| 2018 | $1,229 | $189,210 | $45,000 | $144,210 |
| 2017 | $1,188 | $96,855 | $0 | $0 |
| 2016 | $1,201 | $96,855 | $0 | $0 |
| 2015 | $1,070 | $86,875 | $0 | $0 |
| 2014 | $1,046 | $86,875 | $0 | $0 |
| 2013 | -- | $86,875 | $0 | $0 |
Source: Public Records
Map
Nearby Homes