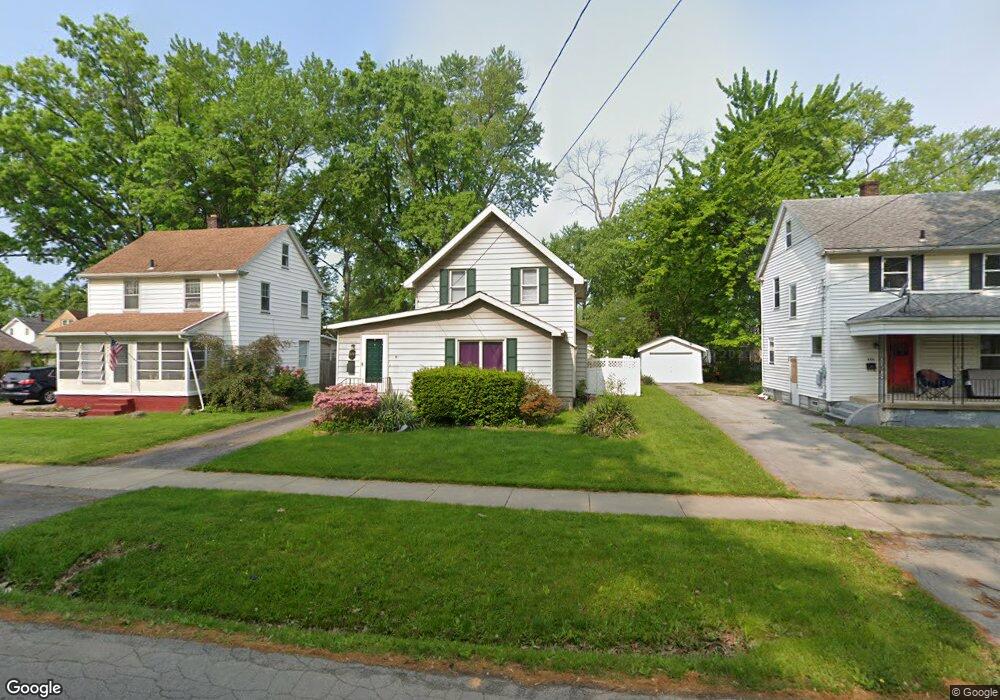
874 Willard Ave SE Warren, OH 44484
Hospital NeighborhoodEstimated Value: $85,000 - $131,000
2
Beds
1
Bath
1,161
Sq Ft
$89/Sq Ft
Est. Value
About This Home
This home is located at 874 Willard Ave SE, Warren, OH 44484 and is currently estimated at $103,026, approximately $88 per square foot. 874 Willard Ave SE is a home located in Trumbull County with nearby schools including Willard PK-8 School, Warren G. Harding High School, and Summit Academy Community School - Warren.
Ownership History
Date
Name
Owned For
Owner Type
Purchase Details
Closed on
Nov 17, 2022
Sold by
Jkv Investor A Spe Llc
Bought by
Nadavon Real Estate Investments Llc
Current Estimated Value
Purchase Details
Closed on
May 6, 2020
Sold by
Jkv Investors Llc
Bought by
Jkv Investors A Lp
Purchase Details
Closed on
Nov 8, 2019
Sold by
Mak Realty Llc
Bought by
Jkv Investors Llc
Home Financials for this Owner
Home Financials are based on the most recent Mortgage that was taken out on this home.
Original Mortgage
$37,500
Interest Rate
3.65%
Purchase Details
Closed on
Aug 22, 2017
Sold by
Klein Michael L
Bought by
Mak Realty Llc
Purchase Details
Closed on
Feb 21, 2017
Sold by
Pnc Bank Na
Bought by
Klein Michael L
Purchase Details
Closed on
Sep 13, 2016
Sold by
Harris Robert C
Bought by
Pnc Bank Na
Purchase Details
Closed on
Jan 1, 1990
Bought by
Amy L Garvin
Create a Home Valuation Report for This Property
The Home Valuation Report is an in-depth analysis detailing your home's value as well as a comparison with similar homes in the area
Home Values in the Area
Average Home Value in this Area
Purchase History
| Date | Buyer | Sale Price | Title Company |
|---|---|---|---|
| Nadavon Real Estate Investments Llc | -- | -- | |
| Jkv Investors A Lp | -- | None Available | |
| Jkv Investors Llc | $42,000 | None Available | |
| Mak Realty Llc | -- | -- | |
| Klein Michael L | $17,975 | Nationallink | |
| Pnc Bank Na | $24,000 | None Available | |
| Amy L Garvin | -- | -- |
Source: Public Records
Mortgage History
| Date | Status | Borrower | Loan Amount |
|---|---|---|---|
| Previous Owner | Jkv Investors Llc | $37,500 |
Source: Public Records
Tax History Compared to Growth
Tax History
| Year | Tax Paid | Tax Assessment Tax Assessment Total Assessment is a certain percentage of the fair market value that is determined by local assessors to be the total taxable value of land and additions on the property. | Land | Improvement |
|---|---|---|---|---|
| 2024 | $1,218 | $24,050 | $2,700 | $21,350 |
| 2023 | $1,218 | $24,050 | $2,700 | $21,350 |
| 2022 | $994 | $15,340 | $2,700 | $12,640 |
| 2021 | $996 | $15,340 | $2,700 | $12,640 |
| 2020 | $997 | $15,340 | $2,700 | $12,640 |
| 2019 | $957 | $13,970 | $2,700 | $11,270 |
| 2018 | $953 | $13,970 | $2,700 | $11,270 |
| 2017 | $938 | $13,970 | $2,700 | $11,270 |
| 2016 | $1,038 | $16,000 | $3,570 | $12,430 |
| 2015 | $1,031 | $16,000 | $3,570 | $12,430 |
| 2014 | $1,025 | $16,000 | $3,570 | $12,430 |
| 2013 | $1,047 | $17,220 | $3,570 | $13,650 |
Source: Public Records
Map
Nearby Homes
- 1057 Willard Ave SE
- 1072 Willard Ave SE
- 1201 Kenmore Ave SE
- 553 Willard Ave SE
- 2252 Youngstown Rd SE
- 1116 Adelaide Ave SE
- 781 Oak Knoll Ave SE
- 548 Adelaide Ave SE
- 1369 Adelaide Ave SE
- 517 Oak Knoll Ave SE
- 0 Youngstown Rd SE
- 821 Woodbine Ave SE
- 710 Woodbine Ave SE
- 327 Adelaide Ave SE
- 249 Central Parkway Ave SE
- 244 Adelaide Ave SE
- 1121 Woodbine Ave SE
- 2816 E Market St
- 2773 Burton St SE
- 1551 Woodbine Ave SE
- 874 Willard Ave SE
- 864 Willard Ave SE
- 884 Willard Ave SE
- 864 Willard Ave SE
- 854 Willard Ave SE
- 875 Kenmore Ave SE
- 885 Kenmore Ave SE
- 2533 Sussex St SE
- 2541 Sussex St SE
- 844 Willard Ave SE
- 865 Kenmore Ave SE
- 844 Willard Ave SE
- 2521 Sussex St SE
- 855 Kenmore Ave SE
- 885 Willard Ave SE
- 845 Kenmore Ave SE
- 2505 Sussex St SE
- 897 Willard Ave SE
- 835 Willard Ave SE
- 835 Kenmore Ave SE