8741 Red Brook Dr Unit 204 Las Vegas, NV 89128
Summerlin NeighborhoodEstimated Value: $337,743 - $346,000
2
Beds
2
Baths
1,333
Sq Ft
$256/Sq Ft
Est. Value
About This Home
This home is located at 8741 Red Brook Dr Unit 204, Las Vegas, NV 89128 and is currently estimated at $341,436, approximately $256 per square foot. 8741 Red Brook Dr Unit 204 is a home located in Clark County with nearby schools including Richard H. Bryan Elementary School, Ernest Becker Middle School, and Cimarron Memorial High School.
Ownership History
Date
Name
Owned For
Owner Type
Purchase Details
Closed on
Feb 18, 2000
Sold by
Hud
Bought by
Brennan Bernard S
Current Estimated Value
Home Financials for this Owner
Home Financials are based on the most recent Mortgage that was taken out on this home.
Original Mortgage
$94,843
Outstanding Balance
$31,353
Interest Rate
8.16%
Mortgage Type
FHA
Estimated Equity
$310,083
Purchase Details
Closed on
Oct 4, 1999
Sold by
Norwest Mtg Inc
Bought by
Hud
Purchase Details
Closed on
Oct 29, 1997
Sold by
Red Hills At The Pueblo Ltd Partnership
Bought by
Bitteker Bret T
Home Financials for this Owner
Home Financials are based on the most recent Mortgage that was taken out on this home.
Original Mortgage
$120,650
Interest Rate
7.36%
Mortgage Type
FHA
Create a Home Valuation Report for This Property
The Home Valuation Report is an in-depth analysis detailing your home's value as well as a comparison with similar homes in the area
Home Values in the Area
Average Home Value in this Area
Purchase History
| Date | Buyer | Sale Price | Title Company |
|---|---|---|---|
| Brennan Bernard S | $97,500 | Stewart Title | |
| Hud | -- | Ati Title | |
| Norwest Mtg Inc | $134,566 | Ati Title | |
| Bitteker Bret T | $128,000 | Nevada Title Company |
Source: Public Records
Mortgage History
| Date | Status | Borrower | Loan Amount |
|---|---|---|---|
| Open | Brennan Bernard S | $94,843 | |
| Previous Owner | Bitteker Bret T | $120,650 |
Source: Public Records
Tax History Compared to Growth
Tax History
| Year | Tax Paid | Tax Assessment Tax Assessment Total Assessment is a certain percentage of the fair market value that is determined by local assessors to be the total taxable value of land and additions on the property. | Land | Improvement |
|---|---|---|---|---|
| 2025 | $1,626 | $66,009 | $27,300 | $38,709 |
| 2024 | $1,506 | $66,009 | $27,300 | $38,709 |
| 2023 | $1,506 | $69,728 | $33,950 | $35,778 |
| 2022 | $1,395 | $58,331 | $25,200 | $33,131 |
| 2021 | $1,292 | $57,057 | $24,850 | $32,207 |
| 2020 | $1,197 | $57,601 | $25,550 | $32,051 |
| 2019 | $1,121 | $52,541 | $20,650 | $31,891 |
| 2018 | $1,070 | $44,069 | $12,950 | $31,119 |
| 2017 | $1,469 | $44,795 | $12,950 | $31,845 |
| 2016 | $1,003 | $42,394 | $11,200 | $31,194 |
| 2015 | $1,000 | $36,859 | $7,700 | $29,159 |
| 2014 | $970 | $30,381 | $8,750 | $21,631 |
Source: Public Records
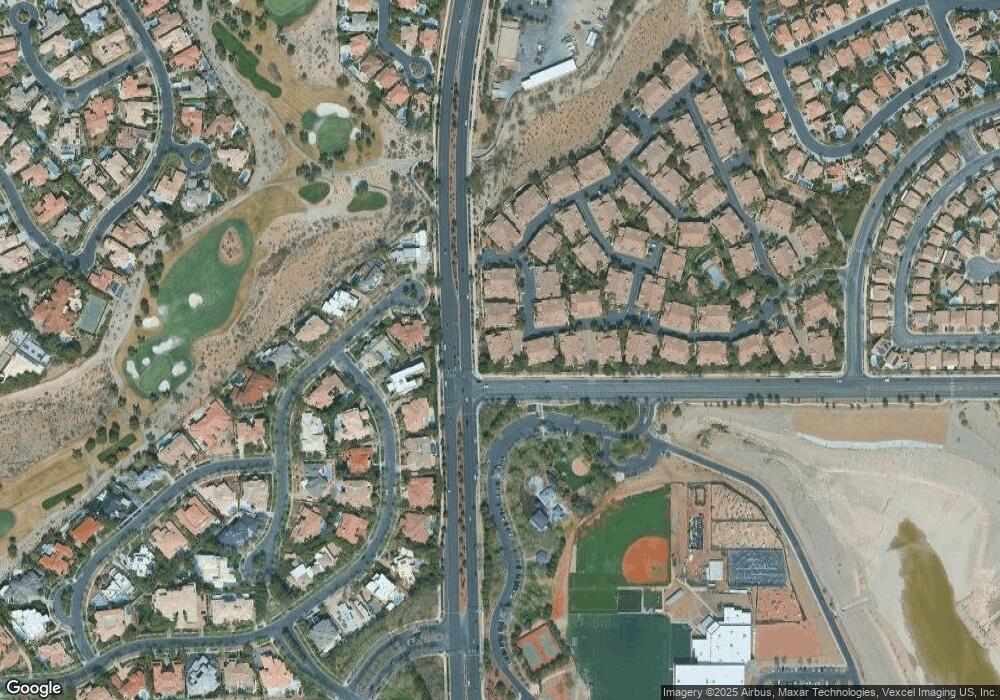
Map
Nearby Homes
- 8737 Red Brook Dr Unit 203
- 8737 Red Brook Dr Unit 201
- 1605 Crimson Hills Dr Unit 204
- 1608 Cardinal Bluff Dr Unit 201
- 8808 Greensboro Ln
- 8721 Red Brook Dr Unit 203
- 8716 Red Rio Dr Unit 103
- 1429 Iron Hills Ln
- 8725 Red Rio Dr Unit 203
- 8612 Sierra Cima Ln
- 1805 Corta Bella Dr
- 1401 Iron Hills Ln
- 1817 Wincanton Dr
- 1720 Plata Pico Dr
- 1008 Trophy Hills Dr
- 1717 Double Arrow Place
- 9040 Thornbury Ln
- 1709 Enclave Ct
- 1501 Faldo St Unit 2
- 8412 Eagle Eye Ave
- 8741 Red Brook Dr Unit 202
- 8741 Red Brook Dr Unit 201
- 8741 Red Brook Dr Unit 104
- 8741 Red Brook Dr Unit 203
- 1601 Crimson Hills Dr Unit 104
- 1601 Crimson Hills Dr Unit 202
- 1601 Crimson Hills Dr Unit 201
- 1601 Crimson Hills Dr Unit 204
- 1601 Crimson Hills Dr Unit 203
- 1601 Crimson Hills Dr Unit 103
- 8737 Red Brook Dr
- 8737 Red Brook Dr Unit 202
- 8737 Red Brook Dr Unit 104
- 1605 Crimson Hills Dr Unit 203
- 1605 Crimson Hills Dr Unit 201
- 1605 Crimson Hills Dr Unit 202
- 1605 Crimson Hills Dr Unit 104
- 1605 Crimson Hills Dr Unit 103
- 8733 Red Brook Dr Unit 103
- 8733 Red Brook Dr Unit 204