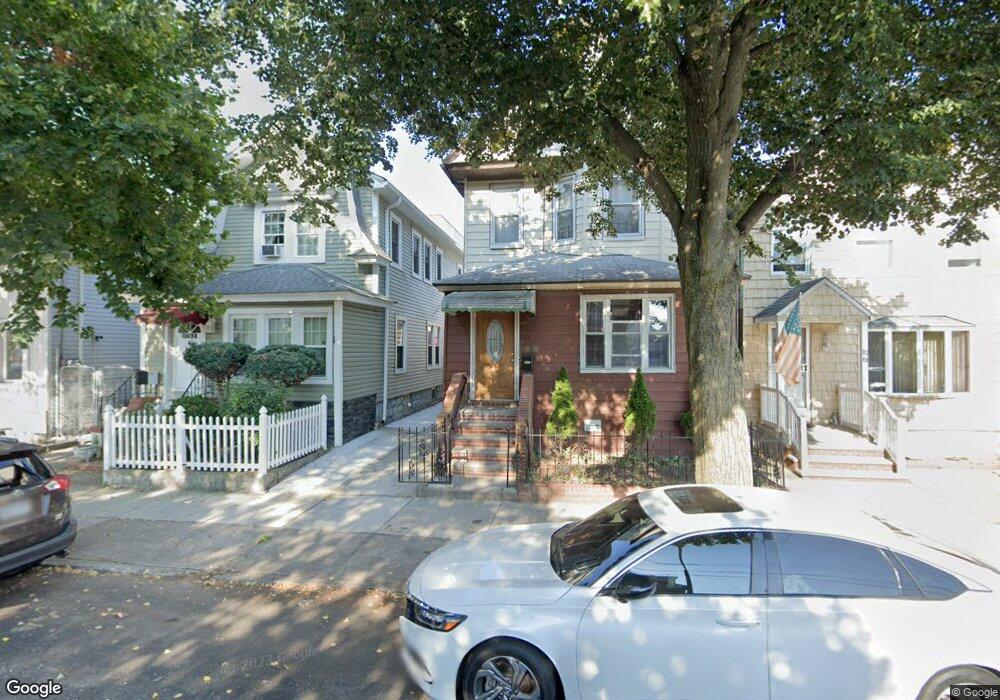
8743 110th St Richmond Hill, NY 11418
Richmond Hill NeighborhoodEstimated Value: $734,951 - $913,000
2
Beds
1
Bath
1,275
Sq Ft
$625/Sq Ft
Est. Value
About This Home
This home is located at 8743 110th St, Richmond Hill, NY 11418 and is currently estimated at $796,988, approximately $625 per square foot. 8743 110th St is a home located in Queens County with nearby schools including P.S. 90 - Horace Mann, M.S.137 America's School of Heroes, and Richmond Hill High School.
Ownership History
Date
Name
Owned For
Owner Type
Purchase Details
Closed on
Jun 7, 2019
Sold by
Lagarde Aida C and Lagarde Renato
Bought by
Lagarde Marc D and Lagarde Shaira R
Current Estimated Value
Home Financials for this Owner
Home Financials are based on the most recent Mortgage that was taken out on this home.
Original Mortgage
$135,331
Outstanding Balance
$118,989
Interest Rate
4.1%
Mortgage Type
Purchase Money Mortgage
Estimated Equity
$677,999
Purchase Details
Closed on
Mar 21, 2011
Sold by
Lagarde Renato F
Bought by
Lagarde Aida C and Lagarde Renato
Home Financials for this Owner
Home Financials are based on the most recent Mortgage that was taken out on this home.
Original Mortgage
$100,938
Interest Rate
5.04%
Purchase Details
Closed on
Oct 27, 2000
Sold by
Clarke Thomas Patrick and Clarke Mary E
Bought by
Lagarde Renato F
Home Financials for this Owner
Home Financials are based on the most recent Mortgage that was taken out on this home.
Original Mortgage
$230,103
Interest Rate
7.78%
Mortgage Type
FHA
Create a Home Valuation Report for This Property
The Home Valuation Report is an in-depth analysis detailing your home's value as well as a comparison with similar homes in the area
Home Values in the Area
Average Home Value in this Area
Purchase History
| Date | Buyer | Sale Price | Title Company |
|---|---|---|---|
| Lagarde Marc D | $550,000 | -- | |
| Lagarde Aida C | -- | -- | |
| Lagarde Renato F | $232,000 | Fidelity National Title Ins |
Source: Public Records
Mortgage History
| Date | Status | Borrower | Loan Amount |
|---|---|---|---|
| Open | Lagarde Marc D | $135,331 | |
| Previous Owner | Lagarde Aida C | $100,938 | |
| Previous Owner | Lagarde Renato F | $230,103 |
Source: Public Records
Tax History Compared to Growth
Tax History
| Year | Tax Paid | Tax Assessment Tax Assessment Total Assessment is a certain percentage of the fair market value that is determined by local assessors to be the total taxable value of land and additions on the property. | Land | Improvement |
|---|---|---|---|---|
| 2025 | $4,948 | $26,113 | $7,109 | $19,004 |
| 2024 | $4,948 | $24,635 | $7,101 | $17,534 |
| 2023 | $4,668 | $23,242 | $7,174 | $16,068 |
| 2022 | $4,640 | $36,720 | $11,760 | $24,960 |
| 2021 | $4,854 | $33,300 | $11,760 | $21,540 |
| 2020 | $4,606 | $34,380 | $11,760 | $22,620 |
| 2019 | $4,002 | $34,860 | $11,760 | $23,100 |
| 2018 | $3,651 | $19,368 | $6,274 | $13,094 |
| 2017 | $3,648 | $19,368 | $7,162 | $12,206 |
| 2016 | $3,533 | $19,368 | $7,162 | $12,206 |
| 2015 | $2,115 | $18,134 | $10,295 | $7,839 |
| 2014 | $2,115 | $17,108 | $11,655 | $5,453 |
Source: Public Records
Map
Nearby Homes
- 87-71 111th St
- 91-14 110th St
- 91-26 110th St
- 87-79 108th St
- 8801 107th St
- 9119 108th St
- 113-10 Jamaica Ave
- 10439 90th Ave
- 114-02 Jamaica Ave
- 10438 Jamaica Ave
- 10423 90th Ave
- 10431 91st Ave
- 91-16 115th St
- 87-34 116th St
- 104-21 92nd Ave
- 114-11 86th Ave
- 9428 112th St
- 8716 104th St
- 86-09 104th St
- 8536 112th St
- 8743 110th St
- 87-41 110th St Unit 1st Fl
- 87-41 110th St
- 8741 110th St Unit 1st Fl
- 8741 110th St Unit 2nd Fl
- 8741 110th St
- 87-53 110th St
- 8747 110th St
- 8741 110th St
- 87-39 110th St
- 8739 110th St
- 8749 110th St
- 8739 110th St
- 87-37 110th St
- 8751 110th St
- 8737 110th St
- 87-33 110th St
- 87-33 110th St Unit 2
- 8753 110th St
- 8733 110th St