8744 Captains Place Las Vegas, NV 89117
The Lakes NeighborhoodHighlights
- Gated Community
- Two cooling system units
- Programmable Thermostat
- Fireplace in Bedroom
- Ceramic Tile Flooring
- Central Heating and Cooling System
About This Home
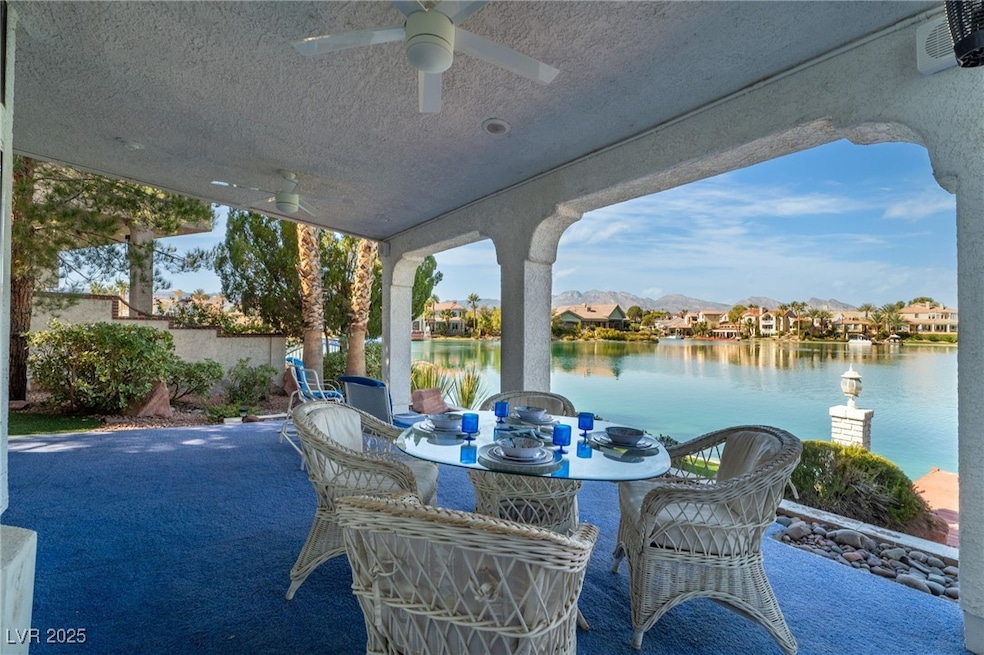
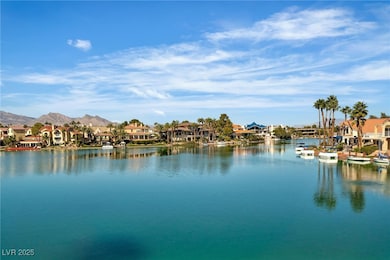
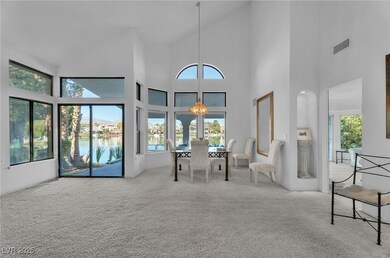
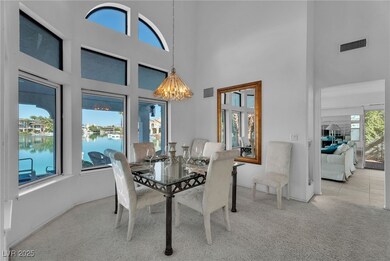
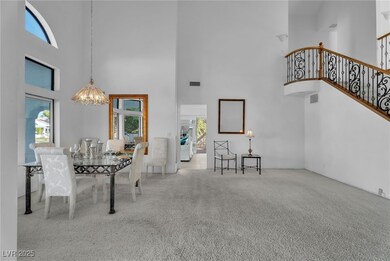
LAKEFRONT LIVING ON LAKE SAHARA - Indulge in the serenity of a waterfront home with breathtaking views from nearly every room. Nestled within The Lakes, an exclusive gated community, enjoy boating and fishing in your backyard. This residence provides a vacation-like lifestyle surrounded by natural beauty, tranquility and lake fun. Three bedrooms and three baths, including a bedroom and 3⁄4 bath downstairs, with an additional versatile room with private access. This space can serve as a bedroom, home gym, or office. Located just minutes from Downtown Summerlin’s premier shopping and dining, and a short drive from the world-renowned Las Vegas Strip, this home touts luxury, enjoyment and convenience. A rare opportunity to lease a lakefront home on Lake Sahara. Bring your kayak, fishing pole, or paddle boat and experience the feeling of being on vacation—every day. Schedule your private viewing and discover all that lakefront living has to offer.
Listing Agent
Signature Real Estate Group Brokerage Phone: (818) 269-3447 License #S.0187189 Listed on: 10/26/2025
Home Details
Home Type
- Single Family
Year Built
- Built in 1987
Lot Details
- 6,534 Sq Ft Lot
- South Facing Home
- Partially Fenced Property
Parking
- 2 Car Garage
- Open Parking
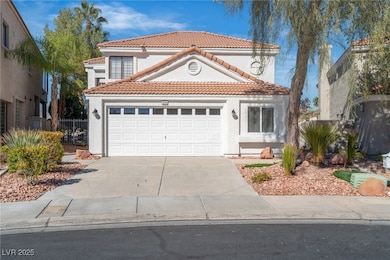
Home Design
- Frame Construction
- Tile Roof
- Stucco
Interior Spaces
- 2,362 Sq Ft Home
- 2-Story Property
- Ceiling Fan
- Gas Fireplace
- Window Treatments
- Family Room with Fireplace
- 2 Fireplaces
Kitchen
- Built-In Electric Oven
- Gas Cooktop
- Microwave
- Dishwasher
- Disposal
Flooring
- Carpet
- Ceramic Tile
Bedrooms and Bathrooms
- 3 Bedrooms
- Fireplace in Bedroom
Laundry
- Laundry on main level
- Washer and Dryer
Schools
- Christensen Elementary School
- Lawrence Middle School
- Spring Valley High School
Utilities
- Two cooling system units
- Central Heating and Cooling System
- Multiple Heating Units
- Heating System Uses Gas
- Programmable Thermostat
- Cable TV Available
Listing and Financial Details
- Security Deposit $4,500
- Property Available on 10/26/25
- Tenant pays for cable TV, electricity, gas, key deposit, trash collection, water
- The owner pays for association fees, grounds care, sewer
Community Details
Overview
- Property has a Home Owners Association
- Lakes Association, Phone Number (702) 869-0937
- Lakes At West Sahara Phase 1 Subdivision
- The community has rules related to covenants, conditions, and restrictions
Recreation
- Dog Park
Pet Policy
- Pets allowed on a case-by-case basis
- Pet Deposit $500
Security
- Gated Community
Map
Property History
| Date | Event | Price | List to Sale | Price per Sq Ft |
|---|---|---|---|---|
| 11/24/2025 11/24/25 | Price Changed | $3,995 | -7.1% | $2 / Sq Ft |
| 10/26/2025 10/26/25 | For Rent | $4,299 | -- | -- |
Source: Las Vegas REALTORS®
MLS Number: 2729233
APN: 163-08-711-019
Disclaimer: Certain information contained herein is derived from information provided by parties other than Homes.com. All information provided is deemed reliable, but is not guaranteed to be accurate and should be independently verified.
![]() The data relating to real estate for sale on this web site comes in part from the INTERNET DATA EXCHANGE Program of the Greater Las Vegas Association of REALTORS® MLS. Real estate listings held by brokerage firms other than this site owner are marked with the IDX logo. Information is deemed reliable but not guaranteed. Copyright 2025 of the Greater Las Vegas Association of REALTORS® MLS. All rights reserved.
The data relating to real estate for sale on this web site comes in part from the INTERNET DATA EXCHANGE Program of the Greater Las Vegas Association of REALTORS® MLS. Real estate listings held by brokerage firms other than this site owner are marked with the IDX logo. Information is deemed reliable but not guaranteed. Copyright 2025 of the Greater Las Vegas Association of REALTORS® MLS. All rights reserved.
- 3141 Waterside Cir
- 3020 Waterside Cir
- 2928 Coast Line Ct
- 2940 Crystal Bay Dr
- 3225 Shoreline Dr
- 3241 Shoreline Dr
- 3313 Coral Harbor Dr
- 3204 Malibu Vista St
- 8924 Sail Bay Dr
- 3315 Royal Bay Dr
- 8653 Freeport Ln
- 3120 Waterview Dr
- 2720 Baycliff Ct Unit 2
- 3236 Shoreheight St
- 3350 Stacey Lyn Dr
- 2825 Waterview Dr
- 2724 Otter Creek Ct Unit 101
- 2605 S Durango Dr Unit 202
- 2603 S Durango Dr Unit 203
- 9021 Feather River Ct
- 8700 Captains Place
- 3228 Mariner Bay St
- 8644 Trafalgar Dr
- 3200 Ivory Coast Dr
- 8600 Starboard Dr
- 3020 Waterview Dr
- 3113 Port Side Dr
- 9025 W Desert Inn Rd
- 3309 Sky Country Ln
- 2812 Waterview Dr
- 2712 Beaver Creek Ct Unit 102
- 2633 S Durango Dr Unit 202
- 2623 S Durango Dr Unit 102
- 8804 River Pines Ct Unit 202
- 2713 Otter Creek Ct Unit 202
- 2750 S Durango Dr Unit 2100
- 2750 S Durango Dr Unit 2010
- 2750 S Durango Dr Unit 2026
- 2750 S Durango Dr Unit 2148
- 2750 S Durango Dr Unit 1102
