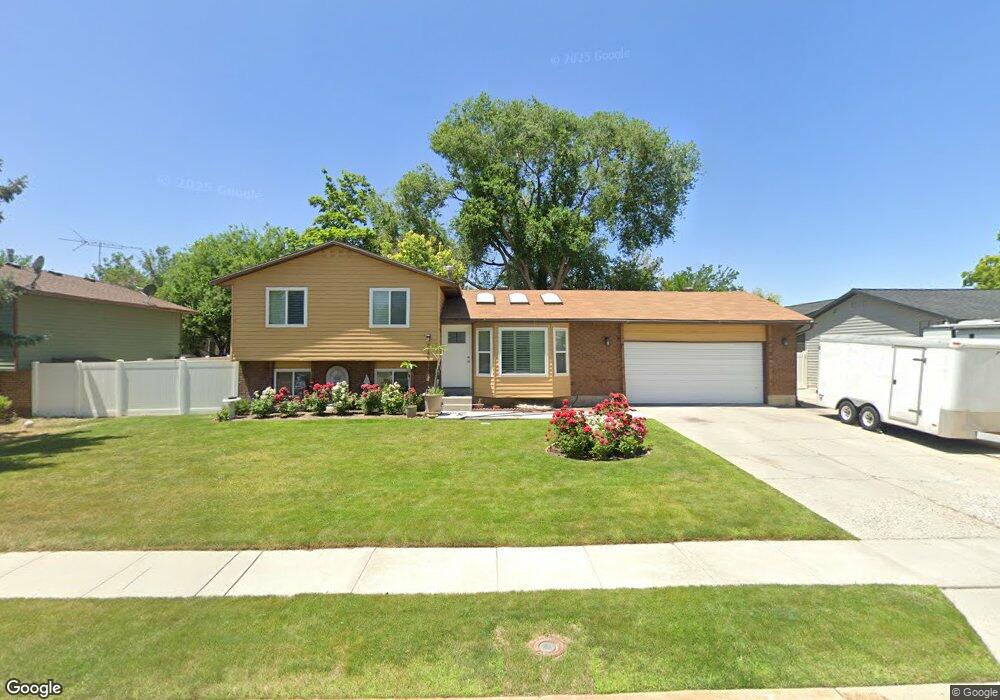
8746 S 1365 W West Jordan, UT 84088
Estimated Value: $482,000 - $535,000
4
Beds
3
Baths
1,800
Sq Ft
$288/Sq Ft
Est. Value
About This Home
This home is located at 8746 S 1365 W, West Jordan, UT 84088 and is currently estimated at $518,728, approximately $288 per square foot. 8746 S 1365 W is a home located in Salt Lake County with nearby schools including Riverside Elementary School, West Jordan Middle School, and West Jordan High School.
Ownership History
Date
Name
Owned For
Owner Type
Purchase Details
Closed on
Sep 21, 2017
Sold by
Nunez Jose Meza and Meza Maria
Bought by
Meza Nunez Sr Jose and Meza Maria D
Current Estimated Value
Home Financials for this Owner
Home Financials are based on the most recent Mortgage that was taken out on this home.
Original Mortgage
$165,000
Outstanding Balance
$137,750
Interest Rate
3.89%
Mortgage Type
New Conventional
Estimated Equity
$380,978
Purchase Details
Closed on
Nov 13, 2002
Sold by
Evans David M
Bought by
Nunez Jose Meza and Meza Maria
Home Financials for this Owner
Home Financials are based on the most recent Mortgage that was taken out on this home.
Original Mortgage
$148,568
Interest Rate
5.95%
Mortgage Type
FHA
Create a Home Valuation Report for This Property
The Home Valuation Report is an in-depth analysis detailing your home's value as well as a comparison with similar homes in the area
Home Values in the Area
Average Home Value in this Area
Purchase History
| Date | Buyer | Sale Price | Title Company |
|---|---|---|---|
| Meza Nunez Sr Jose | -- | Surety Title | |
| Nunez Jose Meza | -- | United Title Services |
Source: Public Records
Mortgage History
| Date | Status | Borrower | Loan Amount |
|---|---|---|---|
| Open | Meza Nunez Sr Jose | $165,000 | |
| Closed | Nunez Jose Meza | $148,568 |
Source: Public Records
Tax History Compared to Growth
Tax History
| Year | Tax Paid | Tax Assessment Tax Assessment Total Assessment is a certain percentage of the fair market value that is determined by local assessors to be the total taxable value of land and additions on the property. | Land | Improvement |
|---|---|---|---|---|
| 2025 | $2,335 | $467,700 | $139,500 | $328,200 |
| 2024 | $2,335 | $449,300 | $128,500 | $320,800 |
| 2023 | $2,327 | $422,000 | $123,500 | $298,500 |
| 2022 | $2,440 | $435,300 | $121,100 | $314,200 |
| 2021 | $2,089 | $339,200 | $93,000 | $246,200 |
| 2020 | $1,997 | $304,300 | $80,400 | $223,900 |
| 2019 | $1,925 | $287,700 | $80,400 | $207,300 |
| 2018 | $1,751 | $259,600 | $76,900 | $182,700 |
| 2017 | $1,628 | $240,300 | $76,900 | $163,400 |
| 2016 | $1,548 | $214,600 | $76,900 | $137,700 |
| 2015 | $1,576 | $213,000 | $82,000 | $131,000 |
| 2014 | $1,416 | $188,500 | $73,300 | $115,200 |
Source: Public Records
Map
Nearby Homes
- 1352 W 8780 S
- 8686 S Temple Dr
- 1424 Stone Meadow Dr
- 1401 W Stone Meadow Dr
- 1434 Autumn Oak Cir
- 1254 W 8680 S
- 1633 W Rockaway Ln
- 8843 Capernaum Rd
- 8772 S Midvalley Dr
- 1773 W 8760 S
- 8713 Mountain Meadow Dr
- 8686 Covewood Place
- 8534 S Redwood Rd
- 9141 S Little Creek Dr
- 8518 S Redwood Rd
- 8510 S Redwood Rd
- 1184 W Michaelsen Way
- 9095 S 1150 W
- 8976 S 1050 W
- 1689 W 8295 S Unit 2