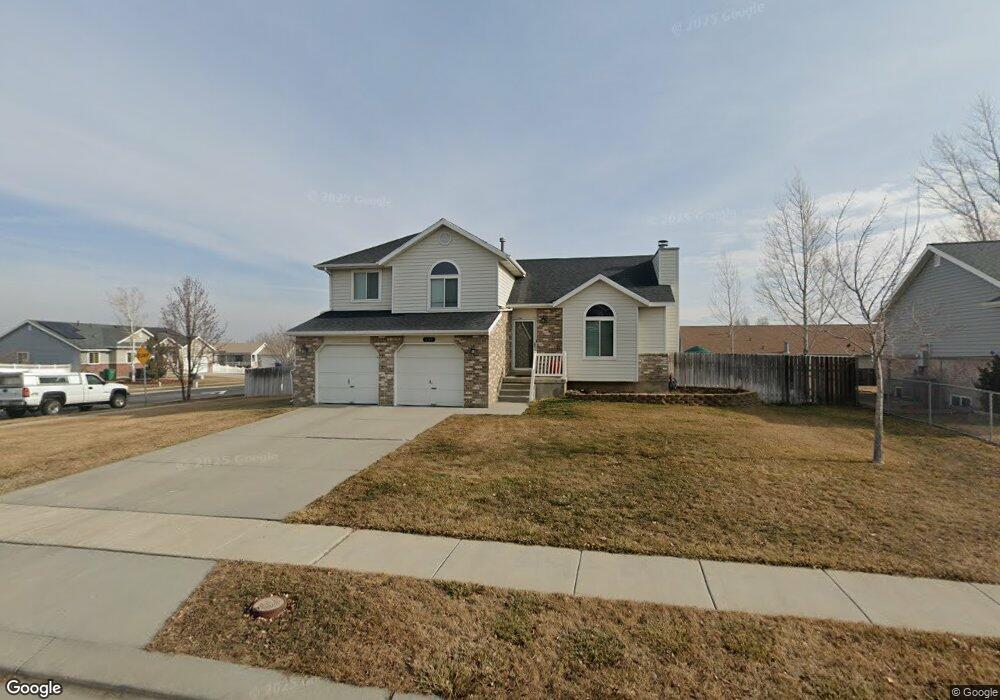
8749 Pebblecreek Rd West Jordan, UT 84081
Copper Hills NeighborhoodEstimated Value: $560,000 - $614,000
6
Beds
3
Baths
2,341
Sq Ft
$251/Sq Ft
Est. Value
About This Home
This home is located at 8749 Pebblecreek Rd, West Jordan, UT 84081 and is currently estimated at $587,090, approximately $250 per square foot. 8749 Pebblecreek Rd is a home located in Salt Lake County with nearby schools including Jordan Hills Elementary School, West Hills Middle School, and Copper Hills High School.
Ownership History
Date
Name
Owned For
Owner Type
Purchase Details
Closed on
May 5, 2020
Sold by
Nielsen Amanda N and Nielsen Kerry M
Bought by
Nielsen Kerry M and Nielsen Amanda N
Current Estimated Value
Home Financials for this Owner
Home Financials are based on the most recent Mortgage that was taken out on this home.
Original Mortgage
$293,000
Outstanding Balance
$260,606
Interest Rate
3.5%
Mortgage Type
New Conventional
Estimated Equity
$326,484
Purchase Details
Closed on
Jul 26, 2016
Sold by
Burrows Sean
Bought by
Hawkins Amanda N and Neilsen Kerry M
Home Financials for this Owner
Home Financials are based on the most recent Mortgage that was taken out on this home.
Original Mortgage
$266,000
Interest Rate
3.54%
Mortgage Type
New Conventional
Purchase Details
Closed on
Mar 31, 2014
Sold by
Howard Samuel R and Gillespie Sonja D
Bought by
Burrows Sean
Home Financials for this Owner
Home Financials are based on the most recent Mortgage that was taken out on this home.
Original Mortgage
$142,000
Interest Rate
4.25%
Mortgage Type
New Conventional
Purchase Details
Closed on
Dec 22, 2008
Sold by
Johnson Nick T and Johnson Mishelle E
Bought by
Howard Samuel R and Gillespie Sonja D
Home Financials for this Owner
Home Financials are based on the most recent Mortgage that was taken out on this home.
Original Mortgage
$234,900
Interest Rate
6.16%
Mortgage Type
FHA
Purchase Details
Closed on
Jan 13, 2006
Sold by
Sirva Relocation Llc
Bought by
Johnson Nick T and Johnson Mishelle E
Home Financials for this Owner
Home Financials are based on the most recent Mortgage that was taken out on this home.
Original Mortgage
$176,400
Interest Rate
6.28%
Mortgage Type
Purchase Money Mortgage
Purchase Details
Closed on
Dec 23, 2005
Sold by
Nay Timothy T
Bought by
Sirva Relocation Llc
Home Financials for this Owner
Home Financials are based on the most recent Mortgage that was taken out on this home.
Original Mortgage
$176,400
Interest Rate
6.28%
Mortgage Type
Purchase Money Mortgage
Purchase Details
Closed on
Feb 21, 2002
Sold by
Palmer Richard and Palmer Marci
Bought by
Nay Timothy T
Home Financials for this Owner
Home Financials are based on the most recent Mortgage that was taken out on this home.
Original Mortgage
$163,688
Interest Rate
7.04%
Mortgage Type
FHA
Purchase Details
Closed on
Jul 2, 1997
Sold by
Alpine Homes Inc
Bought by
Palmer Richard and Palmer Marci
Home Financials for this Owner
Home Financials are based on the most recent Mortgage that was taken out on this home.
Original Mortgage
$131,300
Interest Rate
7.92%
Create a Home Valuation Report for This Property
The Home Valuation Report is an in-depth analysis detailing your home's value as well as a comparison with similar homes in the area
Home Values in the Area
Average Home Value in this Area
Purchase History
| Date | Buyer | Sale Price | Title Company |
|---|---|---|---|
| Nielsen Kerry M | -- | Oasis Title Llc | |
| Hawkins Amanda N | -- | North American Title Agency | |
| Burrows Sean | -- | Title Guarantee | |
| Howard Samuel R | -- | Meridian Title | |
| Johnson Nick T | -- | Bonneville Superior Title | |
| Sirva Relocation Llc | -- | Bonneville Superior Title | |
| Nay Timothy T | -- | First American Title | |
| Palmer Richard | -- | -- |
Source: Public Records
Mortgage History
| Date | Status | Borrower | Loan Amount |
|---|---|---|---|
| Open | Nielsen Kerry M | $293,000 | |
| Closed | Hawkins Amanda N | $266,000 | |
| Previous Owner | Burrows Sean | $142,000 | |
| Previous Owner | Howard Samuel R | $234,900 | |
| Previous Owner | Johnson Nick T | $176,400 | |
| Previous Owner | Sirva Relocation Llc | $33,075 | |
| Previous Owner | Nay Timothy T | $163,688 | |
| Previous Owner | Palmer Richard | $131,300 |
Source: Public Records
Tax History Compared to Growth
Tax History
| Year | Tax Paid | Tax Assessment Tax Assessment Total Assessment is a certain percentage of the fair market value that is determined by local assessors to be the total taxable value of land and additions on the property. | Land | Improvement |
|---|---|---|---|---|
| 2025 | $2,698 | $524,800 | $172,500 | $352,300 |
| 2024 | $2,698 | $519,000 | $170,800 | $348,200 |
| 2023 | $2,714 | $492,100 | $161,100 | $331,000 |
| 2022 | $2,736 | $488,000 | $157,900 | $330,100 |
| 2021 | $2,263 | $367,500 | $122,800 | $244,700 |
| 2020 | $2,125 | $323,800 | $122,800 | $201,000 |
| 2019 | $2,095 | $313,100 | $115,900 | $197,200 |
| 2018 | $1,975 | $292,800 | $115,900 | $176,900 |
| 2017 | $1,878 | $277,200 | $115,900 | $161,300 |
| 2016 | $1,815 | $251,700 | $115,900 | $135,800 |
| 2015 | $1,796 | $242,800 | $122,500 | $120,300 |
| 2014 | $1,657 | $220,500 | $112,600 | $107,900 |
Source: Public Records
Map
Nearby Homes
- 8577 Autumn Gold Cir
- 4887 W 8620 S
- 5098 Cherry Laurel Ln
- 8854 Rocky Creek Dr
- 8441 S Spratling Dr
- 8322 Copper Vista Cir
- 8453 S Windmill Dr
- 7903 Mckenzie Ln
- 7886 Mckenzie Ln
- 4624 Pine Crossing Dr
- 9118 S Wisteria Way
- 8767 S Brown Park Dr
- 9182 Wisteria Way
- 5582 Washoe Cove
- 8359 Etude Dr
- 4904 Wild Acres Dr
- 9332 S Wild Clover Ln
- 4707 W Granada Hills Ct
- 5422 W Island Creek Dr
- 5298 W Icehouse Way
- 8749 S Pebblecreek Rd
- 8761 Pebblecreek Rd
- 8734 S Mcginnis Ln
- 8734 Mcginnis Ln
- 8748 Mcginnis Ln
- 5038 W Old Creek Rd
- 5038 Old Creek Rd
- 8752 S Pebblecreek Rd
- 8752 Pebblecreek Rd
- 5024 Old Creek Rd
- 8773 Pebblecreek Rd
- 8773 S Pebblecreek Rd
- 8762 S Mcginnis Ln
- 8762 Mcginnis Ln
- 4981 W 8740 S Unit 95
- 4981 W 8740 S
- 8764 S Pebblecreek Rd
- 8764 Pebblecreek Rd
- 8712 Mcginnis Ln
- 5064 Old Creek Rd