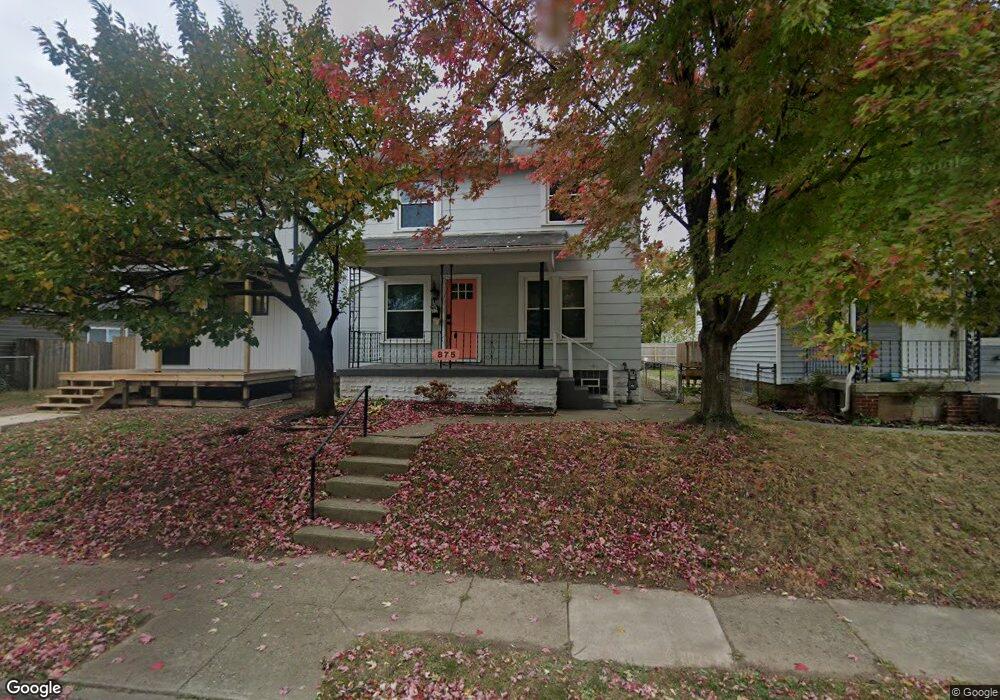
875 Campbell Ave Columbus, OH 43223
Franklinton NeighborhoodEstimated Value: $191,000 - $213,000
3
Beds
1
Bath
1,136
Sq Ft
$178/Sq Ft
Est. Value
About This Home
This home is located at 875 Campbell Ave, Columbus, OH 43223 and is currently estimated at $202,476, approximately $178 per square foot. 875 Campbell Ave is a home located in Franklin County with nearby schools including Sullivant Elementary School, Starling PK-8, and West High School.
Ownership History
Date
Name
Owned For
Owner Type
Purchase Details
Closed on
Mar 23, 2023
Sold by
Hometown Real Estate Llc
Bought by
Randolph Alexandra and Mckenzie Neil
Current Estimated Value
Home Financials for this Owner
Home Financials are based on the most recent Mortgage that was taken out on this home.
Original Mortgage
$189,150
Outstanding Balance
$182,955
Interest Rate
6.65%
Mortgage Type
New Conventional
Estimated Equity
$19,521
Purchase Details
Closed on
Jul 14, 2017
Sold by
Claffey Ricahrd C and Natonstar Mortgage Llc
Bought by
Hometown Real Estate Llc
Purchase Details
Closed on
Jun 20, 2000
Sold by
Moehrman Daniel J and Moehrman Laura M
Bought by
Claffery Richard C
Home Financials for this Owner
Home Financials are based on the most recent Mortgage that was taken out on this home.
Original Mortgage
$47,880
Interest Rate
8.56%
Purchase Details
Closed on
Dec 4, 1992
Bought by
Moehrman Daniel J
Purchase Details
Closed on
Apr 17, 1989
Purchase Details
Closed on
Apr 1, 1986
Create a Home Valuation Report for This Property
The Home Valuation Report is an in-depth analysis detailing your home's value as well as a comparison with similar homes in the area
Home Values in the Area
Average Home Value in this Area
Purchase History
| Date | Buyer | Sale Price | Title Company |
|---|---|---|---|
| Randolph Alexandra | $195,000 | Ohio Real Title | |
| Hometown Real Estate Llc | $37,000 | None Available | |
| Claffery Richard C | $50,900 | 21St Century Title Agency | |
| Moehrman Daniel J | $39,900 | -- | |
| -- | -- | -- | |
| -- | $26,500 | -- |
Source: Public Records
Mortgage History
| Date | Status | Borrower | Loan Amount |
|---|---|---|---|
| Open | Randolph Alexandra | $189,150 | |
| Previous Owner | Claffery Richard C | $47,880 | |
| Closed | Claffery Richard C | $2,500 |
Source: Public Records
Tax History
| Year | Tax Paid | Tax Assessment Tax Assessment Total Assessment is a certain percentage of the fair market value that is determined by local assessors to be the total taxable value of land and additions on the property. | Land | Improvement |
|---|---|---|---|---|
| 2025 | $2,854 | $63,600 | $6,370 | $57,230 |
| 2024 | $2,854 | $63,600 | $6,370 | $57,230 |
| 2023 | $2,427 | $52,710 | $6,370 | $46,340 |
| 2022 | $1,062 | $19,990 | $1,120 | $18,870 |
| 2021 | $1,064 | $19,990 | $1,120 | $18,870 |
| 2020 | $1,066 | $19,990 | $1,120 | $18,870 |
| 2019 | $1,034 | $16,630 | $910 | $15,720 |
| 2018 | $965 | $16,630 | $910 | $15,720 |
| 2017 | $1,292 | $16,630 | $910 | $15,720 |
| 2016 | $823 | $12,430 | $1,440 | $10,990 |
| 2015 | $811 | $12,430 | $1,440 | $10,990 |
| 2014 | $749 | $12,430 | $1,440 | $10,990 |
| 2013 | $411 | $13,825 | $1,610 | $12,215 |
Source: Public Records
Map
Nearby Homes
- 378 Hawkes Ave
- 999 Bellows Ave
- 753 1/2 Sullivant Ave
- 716 S Souder Ave
- 351 Dakota Ave
- 345 Dakota Ave
- 1035 Sullivant Ave
- 1046 Bellows Ave
- 273 Avondale Ave
- 311 Dakota Ave
- 1082 Thomas Ave
- 300 S Cypress Ave
- 186 Avondale Ave Unit 188
- 425 S Glenwood Ave
- 642 Sullivant Ave Unit 642
- 211 Dakota Ave
- 0 S Green St
- 278 S Yale Ave
- 149 S Cypress Ave
- 281 S Yale Ave
- 871 Campbell Ave
- 879 Campbell Ave
- 867 Campbell Ave
- 883 Campbell Ave
- 889 Campbell Ave
- 859 Campbell Ave
- 872 Thomas Ave
- 876 Thomas Ave
- 868 Thomas Ave
- 893 Campbell Ave
- 864 Thomas Ave
- 853 Campbell Ave
- 876 Campbell Ave
- 860 Thomas Ave
- 897 Campbell Ave
- 872 Campbell Ave
- 884 Campbell Ave
- 868 Campbell Ave
- 890 Thomas Ave
- 849 Campbell Ave
Your Personal Tour Guide
Ask me questions while you tour the home.