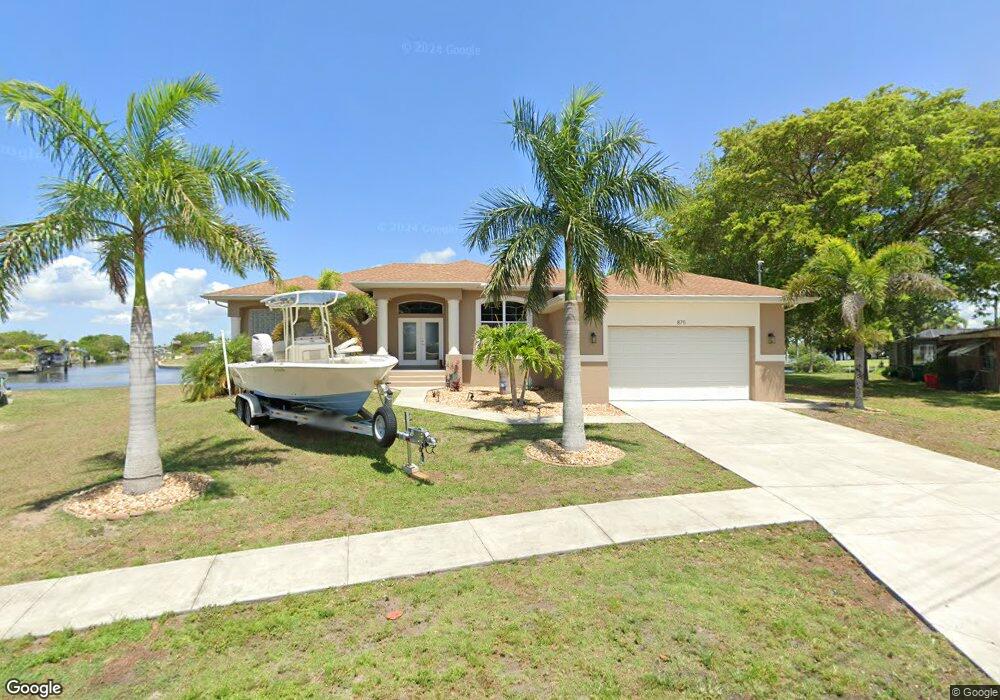
875 Conreid Dr NE Port Charlotte, FL 33952
Estimated Value: $613,000 - $661,000
3
Beds
3
Baths
3,078
Sq Ft
$207/Sq Ft
Est. Value
About This Home
This home is located at 875 Conreid Dr NE, Port Charlotte, FL 33952 and is currently estimated at $636,291, approximately $206 per square foot. 875 Conreid Dr NE is a home located in Charlotte County with nearby schools including Peace River Elementary School, Port Charlotte Middle School, and Charlotte High School.
Ownership History
Date
Name
Owned For
Owner Type
Purchase Details
Closed on
Feb 13, 2025
Sold by
Snell Michael John and Snell Dianne Renee
Bought by
Snell Family Revocable Trust and Snell
Current Estimated Value
Purchase Details
Closed on
Mar 21, 2017
Sold by
Antonucci Clornda
Bought by
Snell Mciahel J and Snell Dianne R
Home Financials for this Owner
Home Financials are based on the most recent Mortgage that was taken out on this home.
Original Mortgage
$283,500
Interest Rate
4.17%
Mortgage Type
New Conventional
Purchase Details
Closed on
Mar 14, 2017
Sold by
Antonucci Clorinda
Bought by
Snell Michael J and Snell Diane R
Home Financials for this Owner
Home Financials are based on the most recent Mortgage that was taken out on this home.
Original Mortgage
$283,500
Interest Rate
4.17%
Mortgage Type
New Conventional
Purchase Details
Closed on
Jul 12, 2001
Sold by
Antonucci Christopher and Antonucci Clorinda
Bought by
Antonucci Clorina
Create a Home Valuation Report for This Property
The Home Valuation Report is an in-depth analysis detailing your home's value as well as a comparison with similar homes in the area
Home Values in the Area
Average Home Value in this Area
Purchase History
| Date | Buyer | Sale Price | Title Company |
|---|---|---|---|
| Snell Family Revocable Trust | $100 | None Listed On Document | |
| Snell Mciahel J | $315,000 | Attorney | |
| Snell Michael J | -- | Attorney | |
| Antonucci Clorina | -- | -- |
Source: Public Records
Mortgage History
| Date | Status | Borrower | Loan Amount |
|---|---|---|---|
| Previous Owner | Snell Michael J | $283,500 |
Source: Public Records
Tax History Compared to Growth
Tax History
| Year | Tax Paid | Tax Assessment Tax Assessment Total Assessment is a certain percentage of the fair market value that is determined by local assessors to be the total taxable value of land and additions on the property. | Land | Improvement |
|---|---|---|---|---|
| 2024 | $9,524 | $610,294 | -- | -- |
| 2023 | $9,524 | $592,518 | $0 | $0 |
| 2022 | $9,266 | $575,260 | $80,750 | $494,510 |
| 2021 | $6,029 | $319,638 | $48,450 | $271,188 |
| 2020 | $5,826 | $307,136 | $46,750 | $260,386 |
| 2019 | $5,712 | $300,460 | $42,500 | $257,960 |
| 2018 | $5,202 | $286,392 | $42,500 | $243,892 |
| 2017 | $4,782 | $256,462 | $42,500 | $213,962 |
| 2016 | $5,129 | $272,230 | $0 | $0 |
| 2015 | $4,518 | $265,593 | $0 | $0 |
| 2014 | $5,116 | $287,132 | $0 | $0 |
Source: Public Records
Map
Nearby Homes
- 21452 Edgewater Dr
- 21444 Higgs Dr
- 180 Palmetto Cir NE
- 156 Morgan Ln SE
- 138 Dowling Ave NE
- 126 Palmetto Cir NE
- 839 Conreid Dr NE
- 138 Leland St SE
- 166 Cummins Ave NE
- 148 Peckham St SE
- 189 Cummins Ave NE
- 119 Palmetto Cir NE
- 164 Morgan Ln SE Unit 412
- 891 Palmetto Dr NE
- 831 Palmetto Dr NE
- 21572 Edgewater Dr
- 140 Poinsettia Cir NE
- 21288 Edgewater Dr
- 124 Leland St SE
- 132 Peckham St SE
- 871 Conreid Dr NE
- 879 Conreid Dr NE
- 870 Conreid Dr NE
- 869 Conreid Dr NE
- 881 Conreid Dr NE
- 169 Palmetto Cir NE
- 868 Conreid Dr NE
- 865 Conreid Dr NE
- 175 Palmetto Cir NE
- 103 Dowling Ave NE
- 102 Dowling Ave NE
- 21398 Edgewater Dr
- 21462 Edgewater Dr
- 864 Conreid Dr NE
- 861 Conreid Dr NE
- 181 Palmetto Cir NE
- 21470 Edgewater Dr
- 161 Palmetto Cir NE
- 107 Dowling Ave NE