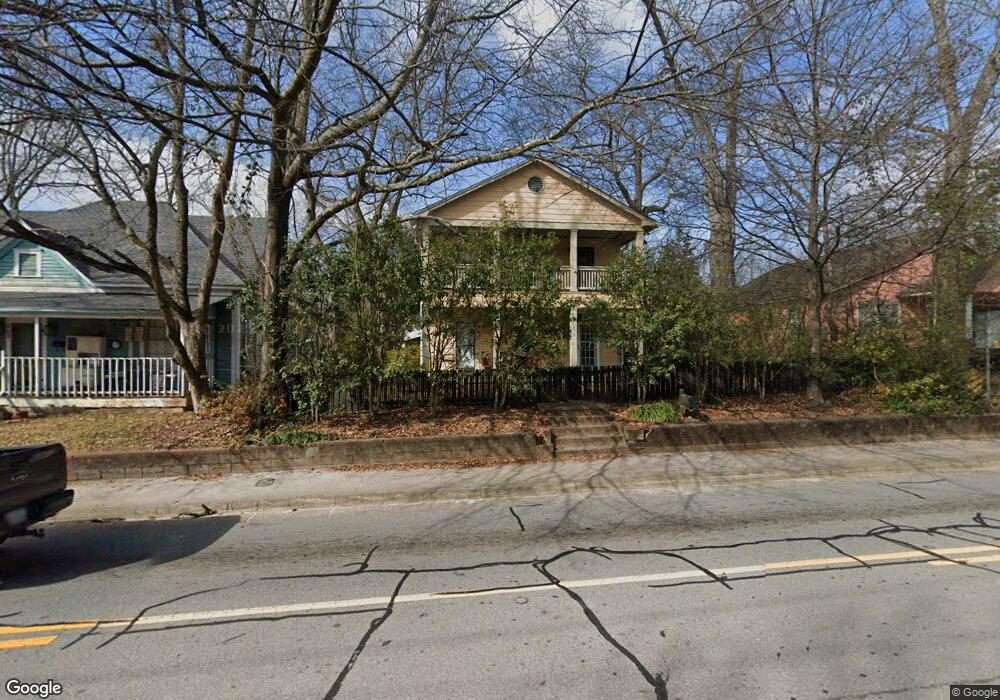
875 N Chase St Athens, GA 30601
Boulevard NeighborhoodEstimated Value: $633,846 - $795,000
4
Beds
3
Baths
1,976
Sq Ft
$362/Sq Ft
Est. Value
About This Home
This home is located at 875 N Chase St, Athens, GA 30601 and is currently estimated at $715,462, approximately $362 per square foot. 875 N Chase St is a home located in Clarke County with nearby schools including Johnnie Lay Burks Elementary School, Clarke Middle School, and Clarke Central High School.
Ownership History
Date
Name
Owned For
Owner Type
Purchase Details
Closed on
Mar 30, 2018
Sold by
Zarnegar Jamshad
Bought by
Goll Mary and Neville Robert
Current Estimated Value
Home Financials for this Owner
Home Financials are based on the most recent Mortgage that was taken out on this home.
Original Mortgage
$376,200
Outstanding Balance
$322,055
Interest Rate
4.43%
Mortgage Type
New Conventional
Estimated Equity
$393,407
Purchase Details
Closed on
May 27, 2009
Sold by
Dawg Country Properties In
Bought by
Zarnegar Jamshad
Purchase Details
Closed on
Mar 18, 2009
Sold by
Little Little and Little Marnie C
Bought by
Dawg Country Properties Inc
Home Financials for this Owner
Home Financials are based on the most recent Mortgage that was taken out on this home.
Original Mortgage
$0
Interest Rate
5.1%
Mortgage Type
New Conventional
Purchase Details
Closed on
Nov 15, 2000
Sold by
Little Lee Isaac
Bought by
Little Marnie C
Purchase Details
Closed on
Oct 26, 1999
Sold by
Towns Delmus P
Bought by
Little Lee Isaac
Create a Home Valuation Report for This Property
The Home Valuation Report is an in-depth analysis detailing your home's value as well as a comparison with similar homes in the area
Home Values in the Area
Average Home Value in this Area
Purchase History
| Date | Buyer | Sale Price | Title Company |
|---|---|---|---|
| Goll Mary | $396,000 | -- | |
| Zarnegar Jamshad | $275,000 | -- | |
| Dawg Country Properties Inc | $170,000 | -- | |
| Little Marnie C | -- | -- | |
| Little Lee Isaac | $17,000 | -- |
Source: Public Records
Mortgage History
| Date | Status | Borrower | Loan Amount |
|---|---|---|---|
| Open | Goll Mary | $376,200 | |
| Previous Owner | Dawg Country Properties Inc | $0 | |
| Closed | Dawg Country Properties Inc | $0 |
Source: Public Records
Tax History
| Year | Tax Paid | Tax Assessment Tax Assessment Total Assessment is a certain percentage of the fair market value that is determined by local assessors to be the total taxable value of land and additions on the property. | Land | Improvement |
|---|---|---|---|---|
| 2025 | $7,830 | $252,169 | $39,000 | $213,169 |
| 2024 | $7,830 | $228,831 | $36,000 | $192,831 |
| 2023 | $7,151 | $213,797 | $33,000 | $180,797 |
| 2022 | $5,507 | $172,637 | $33,000 | $139,637 |
| 2021 | $5,730 | $170,040 | $33,000 | $137,040 |
| 2020 | $5,293 | $157,056 | $33,000 | $124,056 |
| 2019 | $4,885 | $143,879 | $30,000 | $113,879 |
| 2018 | $4,110 | $121,069 | $24,300 | $96,769 |
| 2017 | $3,589 | $105,726 | $24,300 | $81,426 |
| 2016 | $3,347 | $98,588 | $24,300 | $74,288 |
| 2015 | $3,101 | $91,205 | $24,300 | $66,905 |
| 2014 | $3,095 | $90,905 | $24,000 | $66,905 |
Source: Public Records
Map
Nearby Homes
- 947 N Chase St
- 570 Prince Ave
- 524 Hill St
- 390 Athens Ave
- 923 Hill St
- 668 Pulaski St
- 159 Sylvia Cir
- 271 King Ave
- 189 Glenhaven Ave
- 600 Pulaski St
- 1196 W Hancock Ave Unit 1
- 1198 W West Hancock Ave W
- 100 Prince Ave Unit A404
- 100 Prince Ave Unit A407
- 1226 W Broad St
- 1398 W Hancock Ave
- 860 College Ave
- 940 College Ave
- 458 Dearing St
- 800 College Ave
- 863 N Chase St
- 895 N Chase St
- 533 Nantahala Ave
- 533 1/2 Nantahala Ave
- 853 N Chase St
- 537 Nantahala Ave
- 886 N Chase St
- 896 N Chase St
- 915 N Chase St
- 541 Nantahala Ave
- 530 Nantahala Ave Unit 530
- 530 Nantahala Ave Unit 532
- 530 Nantahala Ave
- 815 N Chase St
- 870 N Chase St
- 860 N Chase St
- 850 N Chase St
- 917 N Chase St
- 738 Boulevard
- 465 Nantahala Ave
Your Personal Tour Guide
Ask me questions while you tour the home.