

875 W 1130 N Orem, UT 84057
Bonneville NeighborhoodEstimated payment $2,796/month
Highlights
- Solar Power System
- Mature Trees
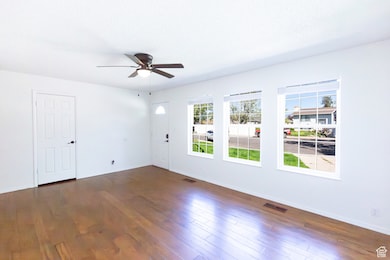
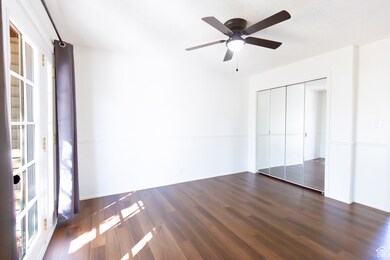
- Wood Flooring
- Timpanogos High School Rated A
- Rambler Architecture
- 1 Fireplace
About This Home
Spacious 6-Bedroom Home in Orem's Timpview Neighborhood Discover this inviting 6-bedroom, 3-bathroom single-family home located in the desirable Timpview neighborhood of Orem. Built in 1977, this 2,880 sq ft residence offers ample space for comfortable living. Generous Living Space: With 2,880 sq ft, the home provides plenty of room for family gatherings and entertaining guests. Six Bedrooms: Ideal for those needing extra space for a home office or guest rooms. Three Bathrooms: Ensuring convenience and privacy for all household members. Established Neighborhood: Situated in a mature area with a sense of community and easy access to local amenities.
Home Details
Home Type
- Single Family
Est. Annual Taxes
- $2,208
Year Built
- Built in 1977
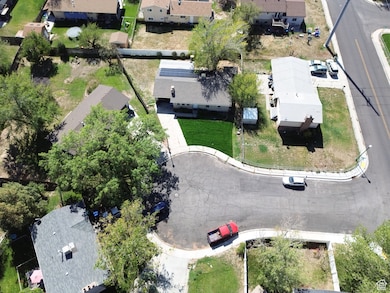
Lot Details
- 10,019 Sq Ft Lot
- Cul-De-Sac
- Property is Fully Fenced
- Landscaped
- Mature Trees
- Pine Trees
- Vegetable Garden
- Property is zoned Single-Family
Parking
- 1 Car Garage
- 2 Open Parking Spaces
Home Design
- Rambler Architecture
- Brick Exterior Construction
- Asphalt
Interior Spaces
- 2,880 Sq Ft Home
- 2-Story Property
- 1 Fireplace
- Double Pane Windows
- Basement Fills Entire Space Under The House
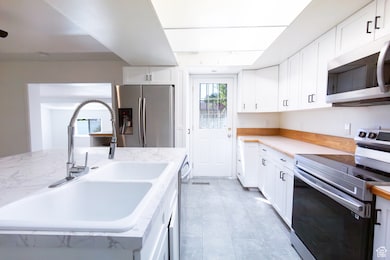
- Free-Standing Range
- Electric Dryer Hookup
Flooring
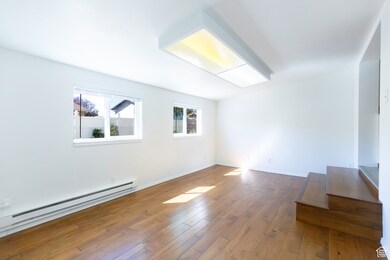
- Wood
- Carpet
- Tile
Bedrooms and Bathrooms
- 6 Bedrooms | 3 Main Level Bedrooms
Eco-Friendly Details
- Solar Power System
- Solar owned by seller
- Cooling system powered by active solar
- Drip Irrigation
Outdoor Features
- Porch
Schools
- Bonneville Elementary School
- Orem Middle School
- Timpanogos High School
Utilities
- Forced Air Heating and Cooling System
- Heating System Uses Wood
- Natural Gas Connected
Community Details
- No Home Owners Association
- Mason Heights Subdivision
Listing and Financial Details
- Assessor Parcel Number 46-032-0005
Map
Home Values in the Area
Average Home Value in this Area
Tax History
| Year | Tax Paid | Tax Assessment Tax Assessment Total Assessment is a certain percentage of the fair market value that is determined by local assessors to be the total taxable value of land and additions on the property. | Land | Improvement |
|---|---|---|---|---|
| 2025 | $2,212 | $287,210 | $202,800 | $319,400 |
| 2024 | $2,212 | $270,490 | $0 | $0 |
| 2023 | $2,029 | $266,640 | $0 | $0 |
| 2022 | $2,117 | $269,555 | $0 | $0 |
| 2021 | $1,973 | $380,400 | $158,400 | $222,000 |
| 2020 | $1,817 | $344,300 | $126,700 | $217,600 |
| 2019 | $1,603 | $315,900 | $126,700 | $189,200 |
| 2018 | $1,586 | $298,600 | $115,800 | $182,800 |
| 2017 | $1,549 | $156,255 | $0 | $0 |
| 2016 | $1,455 | $135,355 | $0 | $0 |
| 2015 | $1,322 | $117,975 | $0 | $0 |
| 2014 | -- | $110,165 | $0 | $0 |
Property History
| Date | Event | Price | List to Sale | Price per Sq Ft |
|---|---|---|---|---|
| 10/08/2025 10/08/25 | Pending | -- | -- | -- |
| 09/30/2025 09/30/25 | Price Changed | $499,000 | -3.9% | $173 / Sq Ft |
| 08/25/2025 08/25/25 | Price Changed | $519,000 | -1.0% | $180 / Sq Ft |
| 07/02/2025 07/02/25 | Price Changed | $524,000 | -2.8% | $182 / Sq Ft |
| 06/04/2025 06/04/25 | For Sale | $539,000 | -- | $187 / Sq Ft |
Purchase History
| Date | Type | Sale Price | Title Company |
|---|---|---|---|
| Warranty Deed | -- | Metro National Title | |
| Warranty Deed | -- | Inwest Title | |
| Warranty Deed | -- | Inwest Title | |
| Interfamily Deed Transfer | -- | -- | |
| Interfamily Deed Transfer | -- | -- |
Mortgage History
| Date | Status | Loan Amount | Loan Type |
|---|---|---|---|
| Open | $467,400 | New Conventional | |
| Previous Owner | $207,900 | New Conventional |
Source: UtahRealEstate.com
MLS Number: 2089405
APN: 46-032-0005
Disclaimer: Certain information contained herein is derived from information provided by parties other than Homes.com. All information provided is deemed reliable, but is not guaranteed to be accurate and should be independently verified.
![]() IDX information is provided exclusively for consumers’ personal, non-commercial use, that it may not be used for any purpose other than to identify prospective properties consumers may be interested in purchasing, and that the data is deemed reliable but is not guaranteed accurate by the MLS. Licensor is only providing the MLS Content and not other sources of data provided in the Product.
IDX information is provided exclusively for consumers’ personal, non-commercial use, that it may not be used for any purpose other than to identify prospective properties consumers may be interested in purchasing, and that the data is deemed reliable but is not guaranteed accurate by the MLS. Licensor is only providing the MLS Content and not other sources of data provided in the Product.
Based on information from the Wasatch Front Regional Multiple Listing Service, Inc.. All data, including all measurements and calculations of area, is obtained from various sources and has not been, and will not be, verified by broker or the MLS. All information should be independently reviewed and verified for accuracy. Properties may or may not be listed by the office/agent presenting the information.
- 999 W 1100 N
- 983 W 1055 N Unit 816
- 1030 N 995 W Unit 915
- 982 W 960 N Unit 109
- 947 N 830 W
- 1015 N 995 W
- 933 N 900 W
- 930 N 980 W
- 1026 N 1090 W Unit 404
- 1081 W 993 N Unit 202
- 1140 W 950 N Unit D304
- 697 W 1400 N
- 582 W 1300 N
- 597 W 1400 N
- 738 N 835 W
- 1175 W 1420 N
- 1415 N 550 West St
- 1335 N 1230 W
- 1561 N 740 W
- 1482 N 550 St W Unit 18
