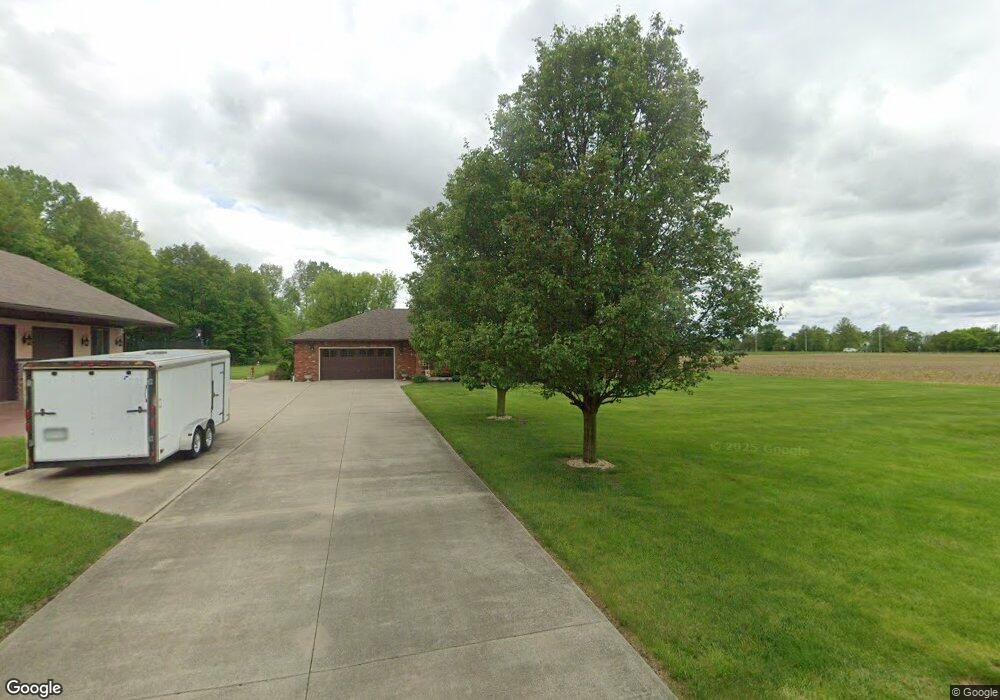
875 W 300 N Anderson, IN 46011
Estimated Value: $258,000 - $361,116
3
Beds
2
Baths
2,820
Sq Ft
$111/Sq Ft
Est. Value
About This Home
This home is located at 875 W 300 N, Anderson, IN 46011 and is currently estimated at $313,029, approximately $111 per square foot. 875 W 300 N is a home located in Madison County with nearby schools including Eastside Elementary School, Highland Middle School, and Anderson High School.
Ownership History
Date
Name
Owned For
Owner Type
Purchase Details
Closed on
Oct 28, 2010
Sold by
Independent Federal Credit Union
Bought by
Cox Levi A and Cox Julie B
Current Estimated Value
Home Financials for this Owner
Home Financials are based on the most recent Mortgage that was taken out on this home.
Original Mortgage
$90,000
Outstanding Balance
$1,349
Interest Rate
4.27%
Mortgage Type
New Conventional
Estimated Equity
$311,680
Purchase Details
Closed on
Jul 24, 2009
Sold by
Ancil George A and Ancil Vicki J
Bought by
Independent Federal Credit Union
Create a Home Valuation Report for This Property
The Home Valuation Report is an in-depth analysis detailing your home's value as well as a comparison with similar homes in the area
Home Values in the Area
Average Home Value in this Area
Purchase History
| Date | Buyer | Sale Price | Title Company |
|---|---|---|---|
| Cox Levi A | -- | -- | |
| Independent Federal Credit Union | $142,500 | -- |
Source: Public Records
Mortgage History
| Date | Status | Borrower | Loan Amount |
|---|---|---|---|
| Open | Cox Levi A | $90,000 |
Source: Public Records
Tax History Compared to Growth
Tax History
| Year | Tax Paid | Tax Assessment Tax Assessment Total Assessment is a certain percentage of the fair market value that is determined by local assessors to be the total taxable value of land and additions on the property. | Land | Improvement |
|---|---|---|---|---|
| 2024 | $2,666 | $247,100 | $20,400 | $226,700 |
| 2023 | $2,870 | $225,700 | $19,400 | $206,300 |
| 2022 | $2,904 | $226,000 | $19,400 | $206,600 |
| 2021 | $2,631 | $207,900 | $19,400 | $188,500 |
| 2020 | $2,520 | $198,600 | $18,500 | $180,100 |
| 2019 | $2,424 | $190,000 | $18,500 | $171,500 |
| 2018 | $2,370 | $175,100 | $18,500 | $156,600 |
| 2017 | $2,035 | $173,700 | $18,500 | $155,200 |
| 2016 | $1,547 | $154,000 | $18,500 | $135,500 |
| 2014 | $1,544 | $155,000 | $18,500 | $136,500 |
| 2013 | $1,544 | $158,500 | $18,500 | $140,000 |
Source: Public Records
Map
Nearby Homes
- 601 Belzer Dr
- 1053 W 300 N
- 2915 Harbur Blvd
- 2413 Silver St
- 391 W 375 N
- 143 E School St
- 305 Mohawk St
- 2717 Apache Dr
- 2334 Poplar St
- 2976 N Scatterfield Rd
- 2722 Dakota Dr
- 2132 Poplar St
- 1907 Lowell Ave
- 2030 Broadway St
- 1820 Whittier Ave
- 724 Iroquois St
- 724 Iroquois Dr
- 2003 Crystal St
- 718 Hawthorne Ave
- 2125 State St