T
Seller's Agent in 2020
Thomas Griffin
Michelle Larnard Real Estate Group LLC
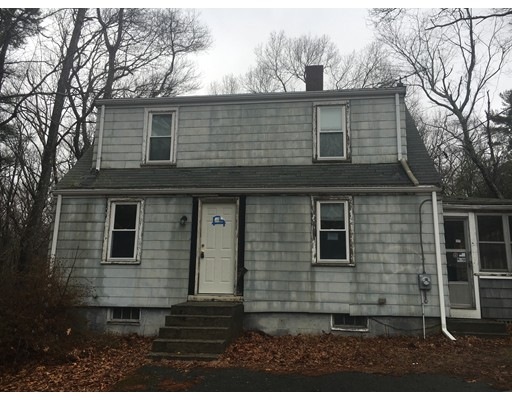
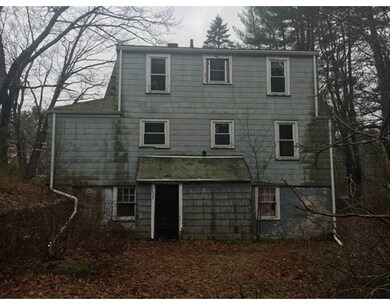
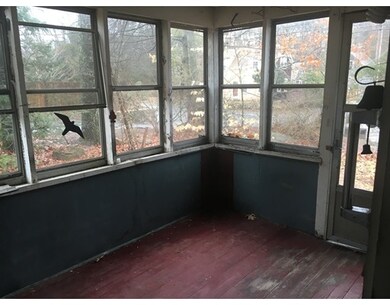
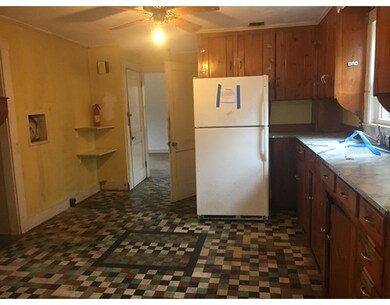
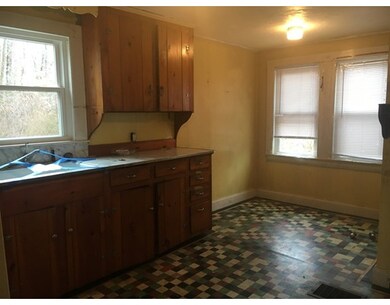
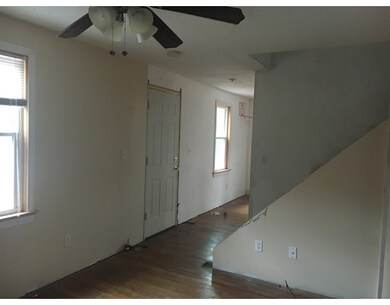
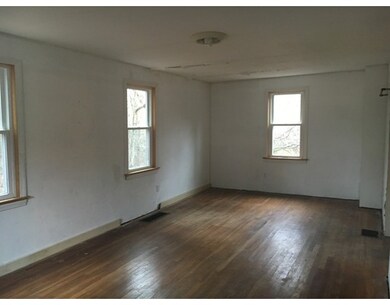
INVESTORS & CONTRACTORS - TAKE NOTICE! DON'T LET THIS ONE PASS YOU BY!- Great opportunity for a flip. Good neighborhood, close to everything.. PLEASE NOTE: THIS PROPERTY IS IN NEED OF EVERYTHING THROUGHOUT, BUT AN EXCELLENT OPPORTUNITY FOR THE RIGHT BUYER; PROPERTY IS BEING SOLD IN "AS-IS" CONDITION. ONLY CASH OFFERS WILL BE ENTERTAINED!!! NO HOME INSPECTIONS / NO CONTINGENCIES. **Please note that for the first 21 DOM only owner-occupant offers will be reviewed. Offers from investors will be reviewed on 5/22/2017.** (Please see 'FIRM REMARKS' section, regarding offer submissions and instructions).
| Date | Type | Sale Price | Title Company |
|---|---|---|---|
| Quit Claim Deed | $475,000 | None Available | |
| Quit Claim Deed | $475,000 | None Available | |
| Quit Claim Deed | $370,000 | -- | |
| Quit Claim Deed | $370,000 | -- | |
| Quit Claim Deed | $224,500 | -- | |
| Quit Claim Deed | $224,500 | -- | |
| Foreclosure Deed | $195,000 | -- | |
| Foreclosure Deed | $195,000 | -- | |
| Deed | -- | -- | |
| Deed | -- | -- | |
| Deed | $205,000 | -- | |
| Deed | $205,000 | -- |
| Date | Status | Loan Amount | Loan Type |
|---|---|---|---|
| Open | $427,500 | New Conventional | |
| Closed | $427,500 | New Conventional | |
| Previous Owner | $351,500 | New Conventional | |
| Previous Owner | $240,000 | No Value Available | |
| Previous Owner | $25,000 | No Value Available |
| Date | Event | Price | Change | Sq Ft Price |
|---|---|---|---|---|
| 12/08/2020 12/08/20 | Sold | $475,000 | -2.9% | $358 / Sq Ft |
| 10/23/2020 10/23/20 | Pending | -- | -- | -- |
| 10/13/2020 10/13/20 | Price Changed | $489,000 | -2.0% | $369 / Sq Ft |
| 10/01/2020 10/01/20 | For Sale | $499,000 | +34.9% | $377 / Sq Ft |
| 07/31/2018 07/31/18 | Sold | $370,000 | -6.3% | $260 / Sq Ft |
| 07/10/2018 07/10/18 | Pending | -- | -- | -- |
| 06/01/2018 06/01/18 | Price Changed | $394,987 | -8.1% | $278 / Sq Ft |
| 04/13/2018 04/13/18 | For Sale | $429,987 | +91.5% | $303 / Sq Ft |
| 06/27/2017 06/27/17 | Sold | $224,500 | -1.5% | $161 / Sq Ft |
| 06/07/2017 06/07/17 | Pending | -- | -- | -- |
| 06/01/2017 06/01/17 | Price Changed | $228,000 | -2.9% | $164 / Sq Ft |
| 05/01/2017 05/01/17 | For Sale | $234,900 | -- | $169 / Sq Ft |
| Year | Tax Paid | Tax Assessment Tax Assessment Total Assessment is a certain percentage of the fair market value that is determined by local assessors to be the total taxable value of land and additions on the property. | Land | Improvement |
|---|---|---|---|---|
| 2025 | $7,158 | $579,600 | $224,500 | $355,100 |
| 2024 | $6,935 | $540,100 | $224,500 | $315,600 |
| 2023 | $6,446 | $477,800 | $204,100 | $273,700 |
| 2022 | $6,457 | $423,400 | $193,900 | $229,500 |
| 2021 | $4,656 | $285,100 | $157,700 | $127,400 |
| 2020 | $4,766 | $292,200 | $167,000 | $125,200 |
| 2019 | $4,519 | $275,400 | $167,000 | $108,400 |
| 2018 | $4,453 | $273,500 | $167,000 | $106,500 |
| 2017 | $4,469 | $270,500 | $160,300 | $110,200 |
| 2016 | $4,360 | $258,600 | $145,800 | $112,800 |
| 2015 | $3,918 | $242,600 | $135,000 | $107,600 |
T
Seller's Agent in 2020
Thomas Griffin
Michelle Larnard Real Estate Group LLC
G
Seller Co-Listing Agent in 2020
Gavin Larnard
Michelle Larnard Real Estate Group LLC

Buyer's Agent in 2020
James Mulvey
Bird Dog Real Estate, LLC
(617) 913-0212
4 in this area
106 Total Sales
Seller's Agent in 2018
Mark Branca
Branca Real Estate
(339) 987-1212
41 Total Sales
Buyer's Agent in 2018
Adam Smith
Coldwell Banker Realty - Boston
(781) 534-2526
1 in this area
117 Total Sales
Seller's Agent in 2017
Brian Gagnon
Coldwell Banker Realty - Boston
(617) 733-3983
1 in this area
55 Total Sales
Source: MLS Property Information Network (MLS PIN)
MLS Number: 72156212
APN: HANO-000014-000000-000041
Disclaimer: Certain information contained herein is derived from information provided by parties other than Homes.com. All information provided is deemed reliable, but is not guaranteed to be accurate and should be independently verified.
![]() The property listing data and information, or the Images, set forth herein were provided to MLS Property Information Network, Inc. from third party sources, including sellers, lessors and public records, and were compiled by MLS Property Information Network, Inc. The property listing data and information, and the Images, are for the personal, non-commercial use of consumers having a good faith interest in purchasing or leasing listed properties of the type displayed to them and may not be used for any purpose other than to identify prospective properties which such consumers may have a good faith interest in purchasing or leasing. MLS Property Information Network, Inc. and its subscribers disclaim any and all representations and warranties as to the accuracy of the property listing data and information, or as to the accuracy of any of the Images, set forth herein.
The property listing data and information, or the Images, set forth herein were provided to MLS Property Information Network, Inc. from third party sources, including sellers, lessors and public records, and were compiled by MLS Property Information Network, Inc. The property listing data and information, and the Images, are for the personal, non-commercial use of consumers having a good faith interest in purchasing or leasing listed properties of the type displayed to them and may not be used for any purpose other than to identify prospective properties which such consumers may have a good faith interest in purchasing or leasing. MLS Property Information Network, Inc. and its subscribers disclaim any and all representations and warranties as to the accuracy of the property listing data and information, or as to the accuracy of any of the Images, set forth herein.