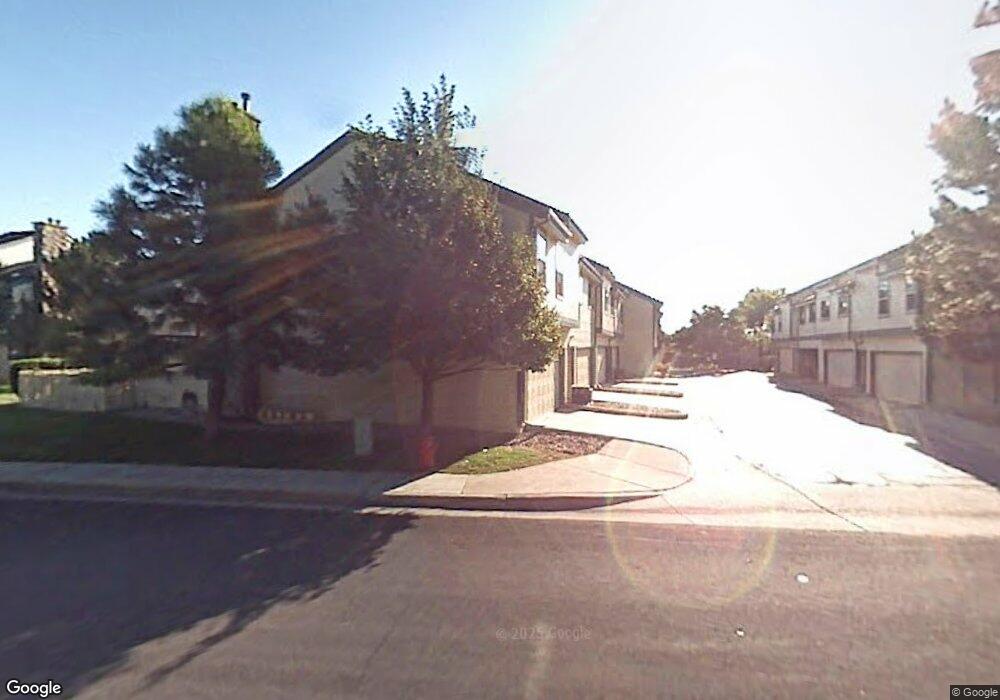
8750 Allison Dr Unit C Arvada, CO 80005
Trailside NeighborhoodEstimated Value: $389,000 - $419,215
3
Beds
3
Baths
1,335
Sq Ft
$303/Sq Ft
Est. Value
About This Home
This home is located at 8750 Allison Dr Unit C, Arvada, CO 80005 and is currently estimated at $405,054, approximately $303 per square foot. 8750 Allison Dr Unit C is a home located in Jefferson County with nearby schools including Weber Elementary School, Moore Middle School, and Pomona High School.
Ownership History
Date
Name
Owned For
Owner Type
Purchase Details
Closed on
Aug 27, 1999
Sold by
Thomas Norman Mark and Thomas Julie A
Bought by
Jacobson Marty M
Current Estimated Value
Home Financials for this Owner
Home Financials are based on the most recent Mortgage that was taken out on this home.
Original Mortgage
$100,100
Outstanding Balance
$29,289
Interest Rate
7.65%
Estimated Equity
$375,765
Purchase Details
Closed on
Mar 12, 1998
Sold by
Thomas Norman Mark
Bought by
Norman Mark T and Norman Julie A
Home Financials for this Owner
Home Financials are based on the most recent Mortgage that was taken out on this home.
Original Mortgage
$75,000
Interest Rate
7.08%
Purchase Details
Closed on
Apr 28, 1995
Sold by
Centex Real Estate Corp
Bought by
Norman Mark Thomas
Home Financials for this Owner
Home Financials are based on the most recent Mortgage that was taken out on this home.
Original Mortgage
$109,250
Interest Rate
8.36%
Create a Home Valuation Report for This Property
The Home Valuation Report is an in-depth analysis detailing your home's value as well as a comparison with similar homes in the area
Home Values in the Area
Average Home Value in this Area
Purchase History
| Date | Buyer | Sale Price | Title Company |
|---|---|---|---|
| Jacobson Marty M | $143,000 | -- | |
| Norman Mark T | -- | -- | |
| Norman Mark Thomas | $115,000 | Title America |
Source: Public Records
Mortgage History
| Date | Status | Borrower | Loan Amount |
|---|---|---|---|
| Open | Jacobson Marty M | $100,100 | |
| Previous Owner | Norman Mark T | $75,000 | |
| Previous Owner | Norman Mark Thomas | $109,250 |
Source: Public Records
Tax History Compared to Growth
Tax History
| Year | Tax Paid | Tax Assessment Tax Assessment Total Assessment is a certain percentage of the fair market value that is determined by local assessors to be the total taxable value of land and additions on the property. | Land | Improvement |
|---|---|---|---|---|
| 2024 | $1,444 | $25,660 | $6,030 | $19,630 |
| 2023 | $1,444 | $25,660 | $6,030 | $19,630 |
| 2022 | $1,182 | $22,150 | $4,170 | $17,980 |
| 2021 | $1,199 | $22,788 | $4,290 | $18,498 |
| 2020 | $1,101 | $21,588 | $4,290 | $17,298 |
| 2019 | $1,084 | $21,588 | $4,290 | $17,298 |
| 2018 | $828 | $17,864 | $3,600 | $14,264 |
| 2017 | $741 | $17,864 | $3,600 | $14,264 |
| 2016 | $569 | $15,196 | $2,866 | $12,330 |
| 2015 | $511 | $15,196 | $2,866 | $12,330 |
| 2014 | $511 | $12,720 | $2,229 | $10,491 |
Source: Public Records
Map
Nearby Homes
- 8750 Allison Dr Unit D
- 8783 Allison Dr Unit D
- 14551 W 91st Ln Unit A
- 7740 W 87th Dr Unit C
- 8731 Yukon St
- 8741 Yukon St
- 7720 W 87th Dr Unit C
- 7780 W 87th Dr Unit E
- 7710 W 87th Dr Unit D
- 7932 W 90th Ave Unit 96
- 7940 W 90th Ave Unit 100
- 7790 W 87th Dr Unit D
- 7870 W 87th Dr Unit J
- 8695 Yukon St Unit D
- 8460 Zephyr St
- 8971 Yukon St
- 8782 Carr Loop
- 8696 W 86th Cir
- 8466 Yarrow St
- 8573 Dover Cir
- 8750 Allison Dr Unit F
- 8750 Allison Dr Unit E
- 8750 Allison Dr Unit A
- 8750 Allison Dr
- 8746 Allison Dr Unit D
- 8746 Allison Dr Unit C
- 8746 Allison Dr Unit B
- 8746 Allison Dr Unit A
- 8746 Allison Dr
- 8758 Allison Dr Unit F
- 8758 Allison Dr Unit E
- 8758 Allison Dr Unit D
- 8758 Allison Dr Unit C
- 8758 Allison Dr Unit B
- 8758 Allison Dr Unit A
- 8758 Allison Dr
- 8754 Allison Dr Unit D
- 8754 Allison Dr Unit C
- 8754 Allison Dr Unit B
- 8754 Allison Dr Unit A