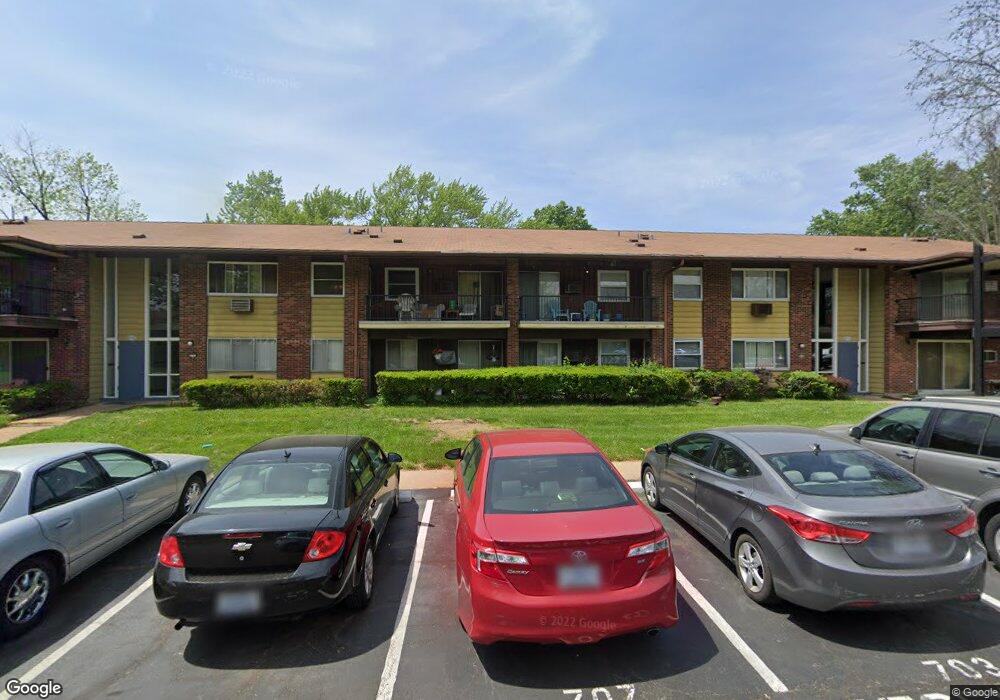
8751 Sieloff Dr Unit G Hazelwood, MO 63042
Estimated Value: $59,435 - $71,000
3
Beds
1
Bath
1,000
Sq Ft
$64/Sq Ft
Est. Value
About This Home
This home is located at 8751 Sieloff Dr Unit G, Hazelwood, MO 63042 and is currently estimated at $64,109, approximately $64 per square foot. 8751 Sieloff Dr Unit G is a home located in St. Louis County with nearby schools including Combs Elementary School, Cross Keys Middle School, and McCluer North High School.
Ownership History
Date
Name
Owned For
Owner Type
Purchase Details
Closed on
Jan 18, 2024
Sold by
Salem Ebrahem
Bought by
Salem Eman and Salem Nabil
Current Estimated Value
Purchase Details
Closed on
Jul 11, 2016
Sold by
Salem Nabil Reman
Bought by
Salem Ebrahem
Purchase Details
Closed on
Jan 17, 2003
Sold by
Downing Lorraine E
Bought by
Salem Nabil and Salem Eman
Home Financials for this Owner
Home Financials are based on the most recent Mortgage that was taken out on this home.
Original Mortgage
$33,250
Interest Rate
5.9%
Purchase Details
Closed on
Jun 22, 2000
Sold by
Winn Donna D
Bought by
Downing Lorraine E
Home Financials for this Owner
Home Financials are based on the most recent Mortgage that was taken out on this home.
Original Mortgage
$35,150
Interest Rate
8.66%
Create a Home Valuation Report for This Property
The Home Valuation Report is an in-depth analysis detailing your home's value as well as a comparison with similar homes in the area
Home Values in the Area
Average Home Value in this Area
Purchase History
| Date | Buyer | Sale Price | Title Company |
|---|---|---|---|
| Salem Eman | -- | None Listed On Document | |
| Salem Ebrahem | -- | None Available | |
| Salem Nabil | $47,500 | Archway Title Agency Inc | |
| Downing Lorraine E | $37,000 | -- |
Source: Public Records
Mortgage History
| Date | Status | Borrower | Loan Amount |
|---|---|---|---|
| Previous Owner | Salem Nabil | $33,250 | |
| Previous Owner | Downing Lorraine E | $35,150 |
Source: Public Records
Tax History Compared to Growth
Tax History
| Year | Tax Paid | Tax Assessment Tax Assessment Total Assessment is a certain percentage of the fair market value that is determined by local assessors to be the total taxable value of land and additions on the property. | Land | Improvement |
|---|---|---|---|---|
| 2025 | $728 | $11,290 | $2,190 | $9,100 |
| 2024 | $728 | $10,530 | $860 | $9,670 |
| 2023 | $735 | $10,530 | $860 | $9,670 |
| 2022 | $557 | $7,030 | $760 | $6,270 |
| 2021 | $554 | $7,030 | $760 | $6,270 |
| 2020 | $570 | $6,760 | $760 | $6,000 |
| 2019 | $553 | $6,760 | $760 | $6,000 |
| 2018 | $477 | $5,240 | $950 | $4,290 |
| 2017 | $474 | $5,240 | $950 | $4,290 |
| 2016 | $344 | $3,710 | $670 | $3,040 |
| 2015 | $346 | $3,710 | $670 | $3,040 |
| 2014 | $593 | $6,330 | $1,220 | $5,110 |
Source: Public Records
Map
Nearby Homes
- 7427 Sieloff Dr Unit A
- 7450 Sieloff Dr Unit B
- 7446 Sieloff Dr Unit H
- 7407 Sieloff Dr Unit F
- 7520 Hazelcrest Dr Unit 227
- 7497 Hazelcrest Dr Unit F
- 200 Calbreath Ct
- 7463 Hazelcrest Dr
- 7594 Hazelcrest Dr Unit B
- 15 Henson Ln
- 7604 Hazelcrest Dr Unit C
- 7222 Hazelcrest Dr
- 7641 Hazelcrest Dr Unit 47
- 7731 Hazelcrest Dr Unit H
- 121 Foxtree Dr
- 50 Saint Walter Ln
- 630 Graham Rd
- 8740 Santa Bella Dr Unit C
- 7350 N Hanley Rd
- 7299 N Hanley Rd Unit B
- 8751 Sieloff Dr Unit B
- 8755 Sieloff Dr Unit D
- 8755 Sieloff Dr Unit F
- 8751 Sieloff Dr Unit F
- 8751 Sieloff Dr Unit E
- 8755 Sieloff Dr Unit B
- 8755 Sieloff Dr Unit E
- 8751 Sieloff Dr Unit D
- 8751 Sieloff Dr Unit C
- 8751 Sieloff Dr Unit H
- 8755 Sieloff Dr Unit G
- 8755 Sieloff Dr Unit H
- 8755 Sieloff Dr Unit A
- 8751 Sieloff Dr Unit A
- 8755 Sieloff Dr Unit C
- 8751 Sieloff Dr
- 19 Gray Brooke Ln
- 8759 Sieloff Dr
- 20 Gray Brooke Ln
- 7518 Hazelcrest Dr Unit 228