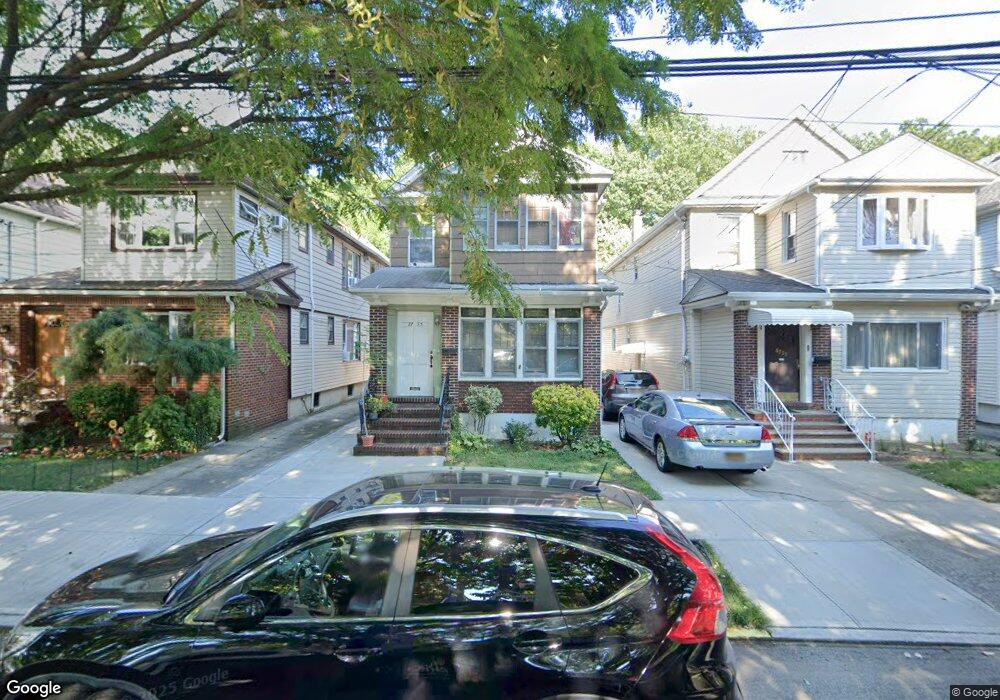
8753 98th St Woodhaven, NY 11421
Woodhaven NeighborhoodEstimated Value: $946,744 - $1,310,000
--
Bed
--
Bath
2,456
Sq Ft
$459/Sq Ft
Est. Value
About This Home
This home is located at 8753 98th St, Woodhaven, NY 11421 and is currently estimated at $1,128,436, approximately $459 per square foot. 8753 98th St is a home located in Queens County with nearby schools including P.S. 254 - The Rosa Parks School, Jhs 210 Elizabeth Blackwell, and Richmond Hill High School.
Ownership History
Date
Name
Owned For
Owner Type
Purchase Details
Closed on
Dec 20, 2007
Sold by
Bilinski John F and Ysip Eleanor M
Bought by
Bilinski John F and Ysip Bilinski Nora
Current Estimated Value
Purchase Details
Closed on
Jul 20, 1994
Sold by
Ramos Susanne L and Pitcher Albert C
Bought by
Bilinski John F and Ysip Nora M
Home Financials for this Owner
Home Financials are based on the most recent Mortgage that was taken out on this home.
Original Mortgage
$154,400
Interest Rate
8.65%
Create a Home Valuation Report for This Property
The Home Valuation Report is an in-depth analysis detailing your home's value as well as a comparison with similar homes in the area
Home Values in the Area
Average Home Value in this Area
Purchase History
| Date | Buyer | Sale Price | Title Company |
|---|---|---|---|
| Bilinski John F | -- | -- | |
| Bilinski John F | -- | -- | |
| Bilinski John F | $193,000 | -- | |
| Bilinski John F | $193,000 | -- |
Source: Public Records
Mortgage History
| Date | Status | Borrower | Loan Amount |
|---|---|---|---|
| Closed | Bilinski John F | $154,400 | |
| Closed | Bilinski John F | -- |
Source: Public Records
Tax History Compared to Growth
Tax History
| Year | Tax Paid | Tax Assessment Tax Assessment Total Assessment is a certain percentage of the fair market value that is determined by local assessors to be the total taxable value of land and additions on the property. | Land | Improvement |
|---|---|---|---|---|
| 2025 | $8,388 | $45,750 | $10,378 | $35,372 |
| 2024 | $8,400 | $43,162 | $11,216 | $31,946 |
| 2023 | $7,898 | $40,721 | $10,121 | $30,600 |
| 2022 | $7,382 | $61,800 | $15,420 | $46,380 |
| 2021 | $7,789 | $54,360 | $15,420 | $38,940 |
| 2020 | $7,774 | $52,320 | $15,420 | $36,900 |
| 2019 | $7,231 | $53,280 | $15,420 | $37,860 |
| 2018 | $6,620 | $33,934 | $10,382 | $23,552 |
| 2017 | $6,226 | $32,014 | $11,507 | $20,507 |
| 2016 | $6,090 | $32,014 | $11,507 | $20,507 |
| 2015 | $3,643 | $31,771 | $16,765 | $15,006 |
| 2014 | $3,643 | $29,974 | $16,023 | $13,951 |
Source: Public Records
Map
Nearby Homes