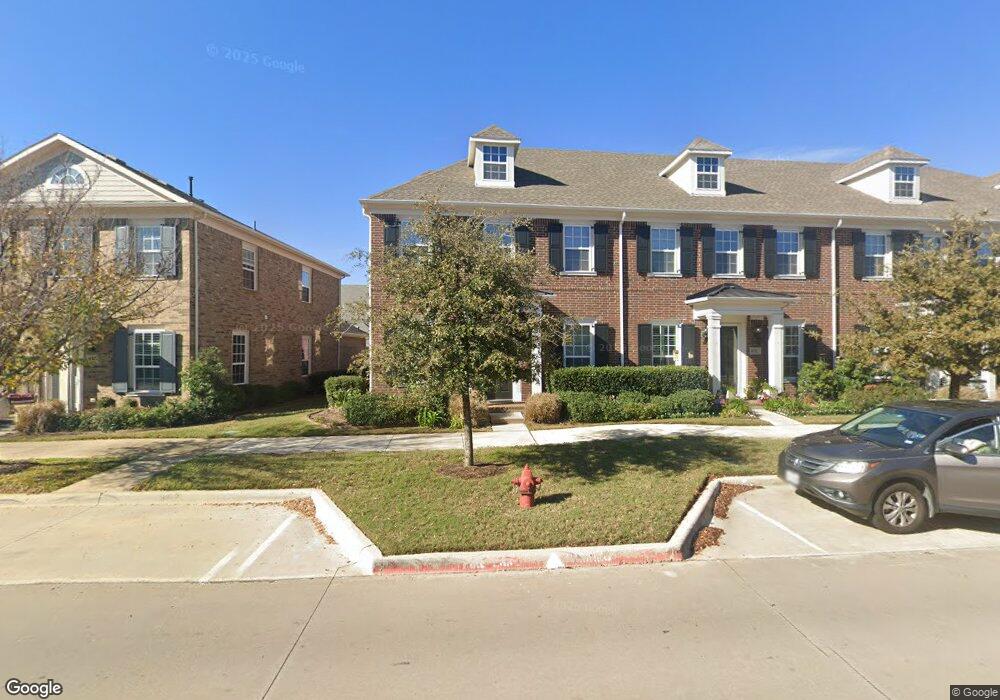
8753 Bridge St North Richland Hills, TX 76180
Estimated Value: $411,339 - $501,000
3
Beds
3
Baths
2,224
Sq Ft
$203/Sq Ft
Est. Value
About This Home
This home is located at 8753 Bridge St, North Richland Hills, TX 76180 and is currently estimated at $450,835, approximately $202 per square foot. 8753 Bridge St is a home located in Tarrant County with nearby schools including Walker Creek Elementary School, Smithfield Middle School, and Birdville High School.
Ownership History
Date
Name
Owned For
Owner Type
Purchase Details
Closed on
Oct 30, 2020
Sold by
Vanrooyen Andrea and Vanrooyen Van Rooyen
Bought by
Cooper Matthew
Current Estimated Value
Home Financials for this Owner
Home Financials are based on the most recent Mortgage that was taken out on this home.
Original Mortgage
$284,750
Outstanding Balance
$253,842
Interest Rate
2.9%
Mortgage Type
New Conventional
Estimated Equity
$196,993
Purchase Details
Closed on
Nov 16, 2016
Sold by
Cb Jeni Hometown Llc
Bought by
Vanrooyen Andrea Van and Vanrooyen Van Jacobus
Home Financials for this Owner
Home Financials are based on the most recent Mortgage that was taken out on this home.
Original Mortgage
$259,781
Interest Rate
3.42%
Create a Home Valuation Report for This Property
The Home Valuation Report is an in-depth analysis detailing your home's value as well as a comparison with similar homes in the area
Home Values in the Area
Average Home Value in this Area
Purchase History
| Date | Buyer | Sale Price | Title Company |
|---|---|---|---|
| Cooper Matthew | -- | Capital Title | |
| Vanrooyen Andrea Van | -- | None Available |
Source: Public Records
Mortgage History
| Date | Status | Borrower | Loan Amount |
|---|---|---|---|
| Open | Cooper Matthew | $284,750 | |
| Previous Owner | Vanrooyen Andrea Van | $259,781 |
Source: Public Records
Tax History Compared to Growth
Tax History
| Year | Tax Paid | Tax Assessment Tax Assessment Total Assessment is a certain percentage of the fair market value that is determined by local assessors to be the total taxable value of land and additions on the property. | Land | Improvement |
|---|---|---|---|---|
| 2025 | $8,157 | $355,000 | $85,000 | $270,000 |
| 2024 | $8,157 | $375,896 | $85,000 | $290,896 |
| 2023 | $9,371 | $427,197 | $70,000 | $357,197 |
| 2022 | $8,939 | $371,459 | $55,000 | $316,459 |
| 2021 | $8,386 | $329,553 | $55,000 | $274,553 |
| 2020 | $8,403 | $330,246 | $55,000 | $275,246 |
| 2019 | $8,715 | $330,940 | $55,000 | $275,940 |
| 2018 | $8,332 | $316,397 | $55,000 | $261,397 |
| 2017 | $7,955 | $295,659 | $55,000 | $240,659 |
| 2016 | $274 | $10,200 | $10,200 | $0 |
| 2015 | -- | $0 | $0 | $0 |
Source: Public Records
Map
Nearby Homes
- 6008 Monterey Mews
- 8765 Bridge St
- 8748 Morris Mews
- 8858 Mandalay St
- 6116 Morningside Dr
- 8908 Redding St
- 6105 Parker Blvd
- 8886 Ice House Dr
- 6124 Mayfair Mews
- 8740 Ice House Dr
- 6137 Marquita Mews
- 6025 Kessler Dr
- 6008 Kessler Dr
- 6001 Kessler Dr
- 8321 Bridge St
- 6113 Cliffbrook Dr
- 6432 Brynwyck Ln
- 6250 Shirley Dr
- 8240 Bridge St
- 8920 Martin Dr