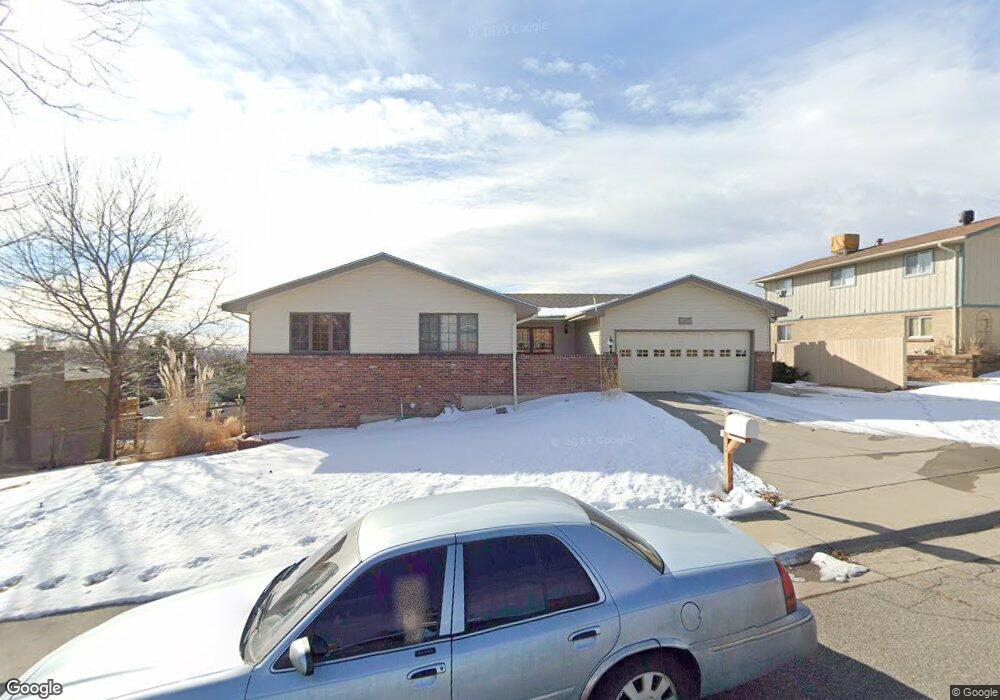
8754 W 66th Cir Arvada, CO 80004
Scenic Heights NeighborhoodEstimated Value: $714,000 - $790,000
5
Beds
3
Baths
3,212
Sq Ft
$231/Sq Ft
Est. Value
About This Home
This home is located at 8754 W 66th Cir, Arvada, CO 80004 and is currently estimated at $741,913, approximately $230 per square foot. 8754 W 66th Cir is a home located in Jefferson County with nearby schools including Secrest Elementary School, Peck Elementary School, and Arvada K-8.
Ownership History
Date
Name
Owned For
Owner Type
Purchase Details
Closed on
Dec 10, 2010
Sold by
Arko John R and Arko Patti J
Bought by
Witherpoon Levi Elwood and Witherspoon Jo Ann
Current Estimated Value
Purchase Details
Closed on
Mar 7, 2007
Sold by
Payte Leonard H and Payte Yvonne C
Bought by
Arko John R and Arko Patti J
Home Financials for this Owner
Home Financials are based on the most recent Mortgage that was taken out on this home.
Original Mortgage
$284,500
Interest Rate
6.32%
Mortgage Type
Purchase Money Mortgage
Purchase Details
Closed on
Dec 15, 1997
Sold by
Stauffer Vyrle D and Stauffer Theodora G
Bought by
Payte Leonard H and Payte Yvonne C
Home Financials for this Owner
Home Financials are based on the most recent Mortgage that was taken out on this home.
Original Mortgage
$25,200
Interest Rate
7.14%
Create a Home Valuation Report for This Property
The Home Valuation Report is an in-depth analysis detailing your home's value as well as a comparison with similar homes in the area
Home Values in the Area
Average Home Value in this Area
Purchase History
| Date | Buyer | Sale Price | Title Company |
|---|---|---|---|
| Witherpoon Levi Elwood | $272,500 | Heritage Title | |
| Arko John R | $305,000 | Land Title Guarantee Company | |
| Payte Leonard H | $184,950 | Stewart Title |
Source: Public Records
Mortgage History
| Date | Status | Borrower | Loan Amount |
|---|---|---|---|
| Previous Owner | Arko John R | $284,500 | |
| Previous Owner | Payte Leonard H | $25,200 |
Source: Public Records
Tax History Compared to Growth
Tax History
| Year | Tax Paid | Tax Assessment Tax Assessment Total Assessment is a certain percentage of the fair market value that is determined by local assessors to be the total taxable value of land and additions on the property. | Land | Improvement |
|---|---|---|---|---|
| 2024 | $4,020 | $48,142 | $20,451 | $27,691 |
| 2023 | $4,020 | $48,142 | $20,451 | $27,691 |
| 2022 | $3,128 | $38,890 | $16,587 | $22,303 |
| 2021 | $3,180 | $40,008 | $17,064 | $22,944 |
| 2020 | $3,368 | $34,902 | $13,341 | $21,561 |
| 2019 | $3,323 | $34,902 | $13,341 | $21,561 |
| 2018 | $3,244 | $33,131 | $10,193 | $22,938 |
| 2017 | $2,970 | $33,131 | $10,193 | $22,938 |
| 2016 | $2,737 | $28,769 | $7,006 | $21,763 |
| 2015 | $2,394 | $28,769 | $7,006 | $21,763 |
| 2014 | $2,394 | $23,641 | $6,293 | $17,348 |
Source: Public Records
Map
Nearby Homes
- 6455 Field St
- 9173 W 66th Place
- 8300 W 67th Ave
- 6355 Carr St
- 6463 Brentwood St
- 6750 Garrison St
- 6801 Carr St
- 6250 Everett Ct Unit E
- 6240 Everett Ct Unit F
- 6409 Brentwood St
- 6200 Estes St
- 8612 W 69th Place
- 6842 Garland St
- 8710 Alta Vista Dr
- 8233 W 62nd Place
- 9175 Cole Dr
- 6958 Brentwood Ct
- 6444 Holland Cir
- 6780 Allison St
- 8090 W 68th Ave
- 8734 W 66th Cir
- 8774 W 66th Cir
- 8747 W 66th Place
- 8777 W 66th Place
- 8717 W 66th Place
- 8765 W 66th Cir
- 8714 W 66th Cir
- 8785 W 66th Cir
- 8745 W 66th Cir
- 8794 W 66th Cir
- 8697 W 66th Place
- 6596 Estes St
- 8796 W 66th Place
- 8725 W 66th Cir
- 6650 Estes St
- 8684 W 66th Cir
- 6594 Estes St
- 8736 W 66th Place
- 8667 W 66th Place
- 8706 W 66th Place