Estimated Value: $235,000 - $298,000
3
Beds
2
Baths
1,754
Sq Ft
$152/Sq Ft
Est. Value
About This Home
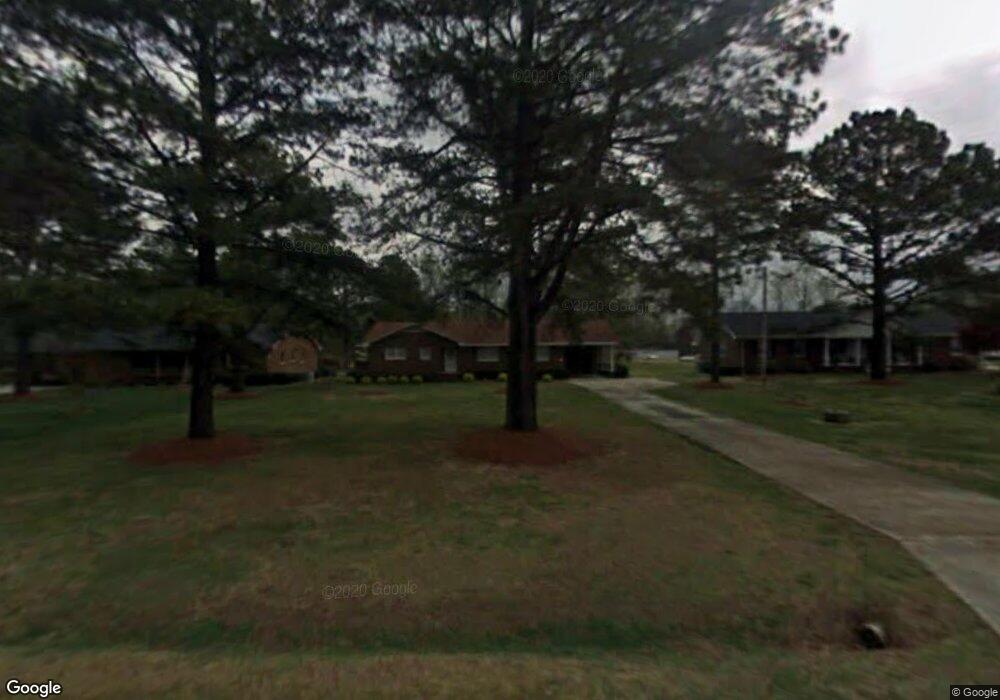
This home is located at 8755 Exum Rd, Kenly, NC 27542 and is currently estimated at $266,550, approximately $151 per square foot. 8755 Exum Rd is a home located in Wilson County with nearby schools including James Hunt High School, Rock Ridge Elementary School, and Springfield Middle School.
Ownership History
Date
Name
Owned For
Owner Type
Purchase Details
Closed on
May 31, 2016
Sold by
Schneider Property Solutions Inc
Bought by
Hyman Terri Godwin and Hyman Brinson Edward
Current Estimated Value
Home Financials for this Owner
Home Financials are based on the most recent Mortgage that was taken out on this home.
Original Mortgage
$76,000
Outstanding Balance
$61,792
Interest Rate
4.25%
Mortgage Type
Adjustable Rate Mortgage/ARM
Estimated Equity
$204,758
Purchase Details
Closed on
Apr 21, 2016
Sold by
Federal Home Loan Mortgage Corporation
Bought by
Schneider Property Solutions Inc
Home Financials for this Owner
Home Financials are based on the most recent Mortgage that was taken out on this home.
Original Mortgage
$76,000
Outstanding Balance
$61,792
Interest Rate
4.25%
Mortgage Type
Adjustable Rate Mortgage/ARM
Estimated Equity
$204,758
Purchase Details
Closed on
Jul 21, 2006
Sold by
Hinnant Damon and Hinnant Lamon
Bought by
Hinnant Damon
Create a Home Valuation Report for This Property
The Home Valuation Report is an in-depth analysis detailing your home's value as well as a comparison with similar homes in the area
Home Values in the Area
Average Home Value in this Area
Purchase History
| Date | Buyer | Sale Price | Title Company |
|---|---|---|---|
| Hyman Terri Godwin | $76,000 | Attorney | |
| Schneider Property Solutions Inc | -- | Attorney | |
| Hinnant Damon | -- | -- |
Source: Public Records
Mortgage History
| Date | Status | Borrower | Loan Amount |
|---|---|---|---|
| Open | Hyman Terri Godwin | $76,000 | |
| Closed | Schneider Property Solutions Inc | $70,000 |
Source: Public Records
Tax History Compared to Growth
Tax History
| Year | Tax Paid | Tax Assessment Tax Assessment Total Assessment is a certain percentage of the fair market value that is determined by local assessors to be the total taxable value of land and additions on the property. | Land | Improvement |
|---|---|---|---|---|
| 2025 | $1,468 | $206,179 | $30,000 | $176,179 |
| 2024 | $1,468 | $206,179 | $30,000 | $176,179 |
| 2023 | $955 | $109,654 | $18,000 | $91,654 |
| 2022 | $955 | $109,654 | $18,000 | $91,654 |
| 2021 | $945 | $109,654 | $18,000 | $91,654 |
| 2020 | $945 | $109,654 | $18,000 | $91,654 |
| 2019 | $945 | $109,654 | $18,000 | $91,654 |
| 2018 | $959 | $109,654 | $18,000 | $91,654 |
| 2017 | $924 | $109,654 | $18,000 | $91,654 |
| 2016 | $959 | $109,654 | $18,000 | $91,654 |
| 2014 | $1,100 | $126,468 | $13,500 | $112,968 |
Source: Public Records
Map
Nearby Homes
- 8072 Springfield
- 8136 Brooks Rd
- 0 Exum Rd
- 0 Brame Rd
- 2830 Beulahtown Rd
- 240 Green Pines Estates Dr
- 214 Green Pines Estates Dr
- 337 Green Pines Estates Dr
- 306 Green Pines Estates Dr
- 130 Green Pines Estates Dr
- 9558 Batten Rd
- 8207 Rock Ridge School Rd
- 69 N Movado Trail
- 185 Movado Trail N
- 207 N Movado Trail
- 5511 Flower Hill Rd
- 13442 N Carolina 42
- 39 Movado Trail N
- 163 N Movado Trail
- 186 N Movado Trail