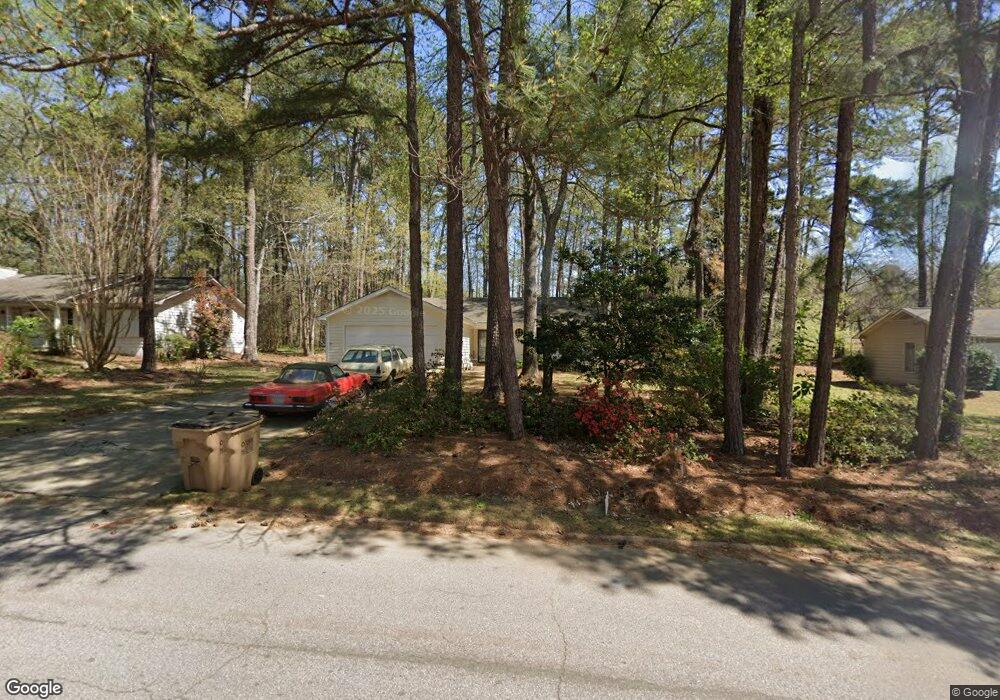
8756 Collins Dr Unit II Jonesboro, GA 30236
Estimated Value: $189,000 - $226,000
3
Beds
2
Baths
1,226
Sq Ft
$167/Sq Ft
Est. Value
About This Home
This home is located at 8756 Collins Dr Unit II, Jonesboro, GA 30236 and is currently estimated at $204,547, approximately $166 per square foot. 8756 Collins Dr Unit II is a home located in Clayton County with nearby schools including Suder Elementary School, Mundys Mill Middle School, and Jonesboro High School.
Ownership History
Date
Name
Owned For
Owner Type
Purchase Details
Closed on
Sep 30, 2016
Sold by
Julie L
Bought by
Welsch John R and Welsch Paulette Y
Current Estimated Value
Purchase Details
Closed on
May 13, 2011
Sold by
Cupertino Julie L
Bought by
Cupertino Julie L and Cupertino Daniel
Purchase Details
Closed on
Dec 30, 1998
Sold by
Stockton Iv Eric W and Stockton Iv Denise R
Bought by
Blocker Jared L and Blocker Stacy M
Home Financials for this Owner
Home Financials are based on the most recent Mortgage that was taken out on this home.
Original Mortgage
$81,600
Interest Rate
6.72%
Mortgage Type
New Conventional
Purchase Details
Closed on
Mar 21, 1994
Sold by
Barnes Sandra D
Bought by
Stockton Eric W and Coneff Denise R
Home Financials for this Owner
Home Financials are based on the most recent Mortgage that was taken out on this home.
Original Mortgage
$71,121
Interest Rate
7.2%
Mortgage Type
FHA
Create a Home Valuation Report for This Property
The Home Valuation Report is an in-depth analysis detailing your home's value as well as a comparison with similar homes in the area
Home Values in the Area
Average Home Value in this Area
Purchase History
| Date | Buyer | Sale Price | Title Company |
|---|---|---|---|
| Welsch John R | $25,875 | -- | |
| Cupertino Julie L | -- | -- | |
| Cupertino Julie L | $45,500 | -- | |
| Blocker Jared L | $85,900 | -- | |
| Stockton Eric W | $72,000 | -- |
Source: Public Records
Mortgage History
| Date | Status | Borrower | Loan Amount |
|---|---|---|---|
| Previous Owner | Blocker Jared L | $81,600 | |
| Previous Owner | Stockton Eric W | $71,121 |
Source: Public Records
Tax History Compared to Growth
Tax History
| Year | Tax Paid | Tax Assessment Tax Assessment Total Assessment is a certain percentage of the fair market value that is determined by local assessors to be the total taxable value of land and additions on the property. | Land | Improvement |
|---|---|---|---|---|
| 2024 | $1,232 | $71,680 | $7,200 | $64,480 |
| 2023 | $2,486 | $68,840 | $7,200 | $61,640 |
| 2022 | $0 | $56,920 | $7,200 | $49,720 |
| 2021 | $725 | $45,400 | $7,200 | $38,200 |
| 2020 | $638 | $40,170 | $7,200 | $32,970 |
| 2019 | $571 | $36,028 | $6,400 | $29,628 |
| 2018 | $571 | $36,005 | $6,400 | $29,605 |
| 2017 | $43 | $10,350 | $6,400 | $3,950 |
| 2016 | $1,243 | $29,676 | $6,400 | $23,276 |
| 2015 | $1,083 | $0 | $0 | $0 |
| 2014 | $1,041 | $25,297 | $6,400 | $18,897 |
Source: Public Records
Map
Nearby Homes
- 8645 Embrey Dr
- 1726 Sherry Ln
- 57 Teal Trail NE
- 111 Teal Trail
- 1738 Sherry Ln Unit 3
- 8698 Twin Oaks Dr
- 1558 Thornwood Ct
- 304 Mercer Dr
- 8832 Twin Oaks Dr Unit 2
- 242 Lake Jodeco Rd
- 1485 Red Briar Way
- 1433 Butler St
- 1519 Red Briar Way
- 1457 Brownleaf Dr
- 8562 Jarrard Ct
- 116 Thornton Dr
- 8971 Thornton Blvd
- 9132 Endicott Place
- 9124 Ogala Ct
- 1730 Salina Dr
- 8744 Collins Dr
- 8770 COLLINS Collins Dr
- 8770 Collins Dr
- 8734 Collins Dr Unit II
- 8778 Collins Dr
- 8741 Collins Dr Unit 1
- 1598 Camp Dr Unit I
- 8777 Collins Dr Unit 1
- 8726 Collins Dr
- 1610 Camp Dr Unit 1
- 8733 Collins Dr
- 1586 Camp Dr Unit 1
- 8774 Embrey Dr Unit 1
- 1614 Camp Dr
- 8723 Collins Dr
- 8785 Collins Dr
- 0 Camp Dr Unit 7230679
- 0 Camp Dr
- 1604 Camp Dr
- 8716 Collins Dr