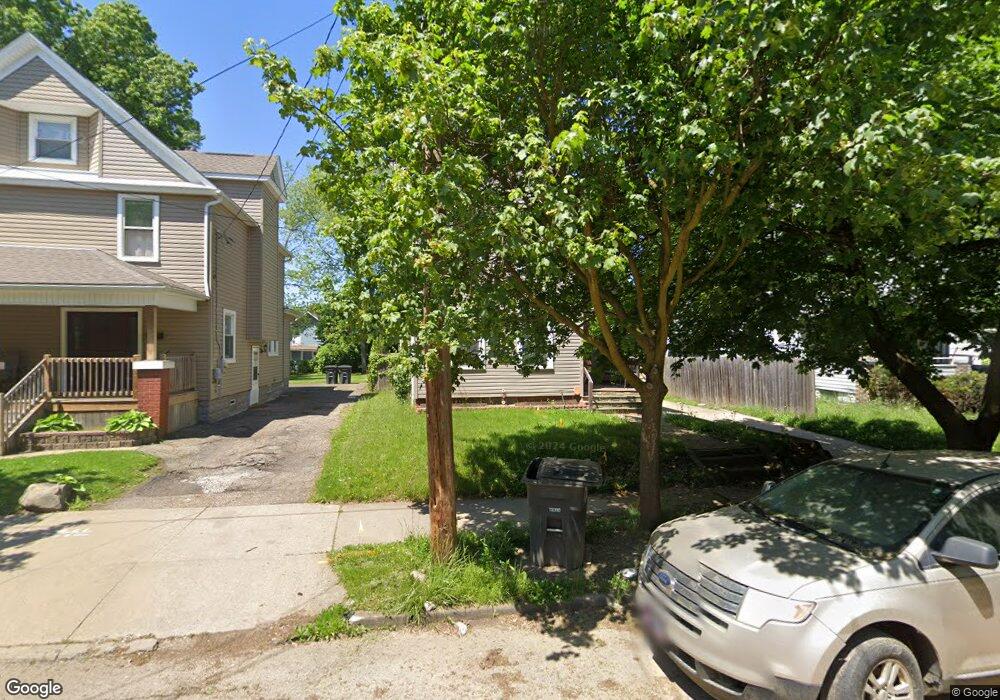
876 Beardsley St Akron, OH 44311
South Akron NeighborhoodEstimated Value: $71,000 - $88,000
3
Beds
1
Bath
1,216
Sq Ft
$63/Sq Ft
Est. Value
About This Home
This home is located at 876 Beardsley St, Akron, OH 44311 and is currently estimated at $76,545, approximately $62 per square foot. 876 Beardsley St is a home located in Summit County with nearby schools including McEbright Elementary School, Kenmore Garfield Community Learning Center, and Main Preparatory Academy.
Ownership History
Date
Name
Owned For
Owner Type
Purchase Details
Closed on
Oct 29, 2010
Sold by
Felix Miguel and Carabin Gloria Elena
Bought by
Felix Jose A
Current Estimated Value
Purchase Details
Closed on
Dec 12, 2007
Sold by
Fannie Mae
Bought by
Felix Miguel
Purchase Details
Closed on
Aug 8, 2007
Sold by
Swails Lamarr J
Bought by
Federal National Mortgage Association
Purchase Details
Closed on
Jan 29, 2002
Sold by
Millican Rodney
Bought by
Swails Lamarr J and Swails Sharett D
Home Financials for this Owner
Home Financials are based on the most recent Mortgage that was taken out on this home.
Original Mortgage
$56,650
Interest Rate
7.26%
Mortgage Type
VA
Create a Home Valuation Report for This Property
The Home Valuation Report is an in-depth analysis detailing your home's value as well as a comparison with similar homes in the area
Home Values in the Area
Average Home Value in this Area
Purchase History
| Date | Buyer | Sale Price | Title Company |
|---|---|---|---|
| Felix Jose A | $2,812 | Quest Title Agency Inc | |
| Felix Miguel | $10,000 | Beacon Title | |
| Federal National Mortgage Association | $50,000 | None Available | |
| Swails Lamarr J | $56,700 | Midland Commerce Group |
Source: Public Records
Mortgage History
| Date | Status | Borrower | Loan Amount |
|---|---|---|---|
| Previous Owner | Swails Lamarr J | $56,650 |
Source: Public Records
Tax History
| Year | Tax Paid | Tax Assessment Tax Assessment Total Assessment is a certain percentage of the fair market value that is determined by local assessors to be the total taxable value of land and additions on the property. | Land | Improvement |
|---|---|---|---|---|
| 2024 | $834 | $14,431 | $4,249 | $10,182 |
| 2023 | $834 | $14,431 | $4,249 | $10,182 |
| 2022 | $643 | $8,488 | $2,499 | $5,989 |
| 2021 | $644 | $8,488 | $2,499 | $5,989 |
| 2020 | $635 | $8,490 | $2,500 | $5,990 |
| 2019 | $1,151 | $14,840 | $4,660 | $10,180 |
| 2018 | $1,137 | $14,840 | $4,660 | $10,180 |
| 2017 | $1,171 | $14,840 | $4,660 | $10,180 |
| 2016 | $1,172 | $15,060 | $4,660 | $10,400 |
| 2015 | $1,171 | $15,060 | $4,660 | $10,400 |
| 2014 | $1,162 | $15,060 | $4,660 | $10,400 |
| 2013 | $1,180 | $15,640 | $4,660 | $10,980 |
Source: Public Records
Map
Nearby Homes
- 888 Beardsley St
- 885 Brown St
- 796 Allyn St
- 891 Grant St
- 543 Corice St
- 778 Brown St Unit 780
- 805 Sumner St
- 555 Corice St
- 1012 Kling St
- 756 Brown St
- 566 Mckinley Ave
- 750 Brown St
- 796 Sherman St
- 586 Morgan Ave
- 413 Stanton Ave
- 1051 Brown St
- 301 E Voris St
- 1100 Beardsley St
- 568 Stanton Ave
- 1094 Dietz Ave
- 880 Beardsley St
- 874 Beardsley St
- 886 Beardsley St
- 870 Beardsley St
- 866 Beardsley St
- 866 Beardsley St Unit 1
- 866 Beardsley St Unit 3
- 883 Berghoff St
- 887 Berghoff St
- 891 Berghoff St
- 881 Berghoff St
- 895 Berghoff St
- 860 Beardsley St
- 892 Beardsley St
- 897 Berghoff St
- 875 Berghoff St
- 881 Beardsley St
- 875 Beardsley St
- 871 Berghoff St
- 879 Beardsley St
Your Personal Tour Guide
Ask me questions while you tour the home.