NOT LISTED FOR SALE

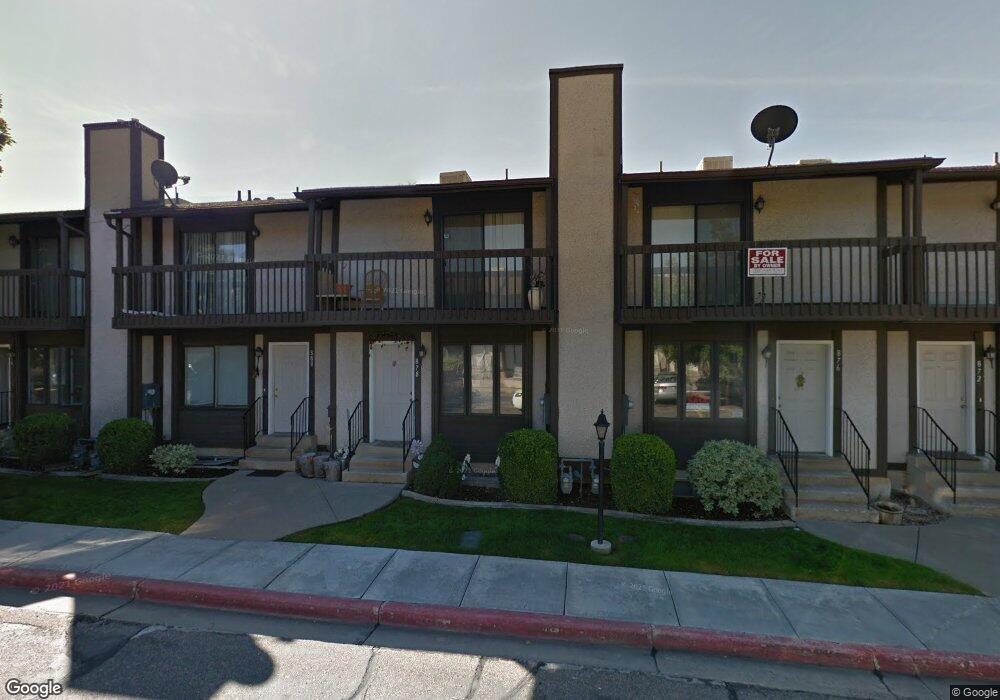
876 E 575 N Layton, UT 84041

Estimated Value: $310,176 - $334,000

3 Beds
2 Baths
1,539 Sq Ft
$207/Sq Ft Est. Value

About This Home

This home is located at 876 E 575 N, Layton, UT 84041 and is currently estimated at $318,794, approximately $207 per square foot. 876 E 575 N is a home located in Davis County with nearby schools including King Elementary School, Central Davis Junior High School, and Layton High School.

Ownership History

Date Name Owned For Owner Type

Purchase Details

Closed on
Jun 3, 2016
Sold by
Pelton Jordan J and Pelton Gillian A
Bought by
Olney Sondra
Current Estimated Value
$318,794

Purchase Details

Closed on
Aug 29, 2007
Sold by
Israelsen Janice W and Israelsen Kyle V
Bought by
Pelton Jordan J and Pelton Gillian A

Home Financials for this Owner

Home Financials are based on the most recent Mortgage that was taken out on this home.
Original Mortgage
$127,000
Interest Rate
6.74%
Mortgage Type
Purchase Money Mortgage

Purchase Details

Closed on
Feb 24, 1998
Sold by
Winward Janice and Israelsen Janice W
Bought by
Israelsen Kyle and Israelsen Janice W

Home Financials for this Owner

Home Financials are based on the most recent Mortgage that was taken out on this home.
Original Mortgage
$32,510
Interest Rate
6.9%
Mortgage Type
Purchase Money Mortgage

Range of Values:

Collateral Analytics

Collateral Analytics Collateral Analytics AVMs (Automated Valuation Model) employ a number of statistical approaches combined with neighborhood-specific comparable selection guarantees the most up-to-date and precise valuations.

Not Available

Collateral Analytics does not have data for the current month. Please view the chart for historical values.

ICE

ICE Mortgage Technology ICE Mortgage Technology’s AVM (Automated Valuation Model) is a state-of-the-art online residential property valuation tool that provides a quick and accurate estimate of the value of almost any home in the U.S.

Not Available

ICE Mortgage Technology does not have data for the current month. Please view the chart for historical values.

First American

First American First American Data & Analytics’ next-generation AVM combines unrivaled data assets with a blended ensemble of valuation models to produce highly accurate, reliable valuations you can trust.

Not Available

First American does not have data for the current month. Please view the chart for historical values.

Quantarium

Quantarium Quantarium’s valuation service, repeatedly proven the industry’s most accurate and comprehensive, is supercharged with a self-learning and auto-tuning AI engine that continually becomes smarter and more accurate as it processes daily inputs from the industry’s leading RE data lake.

Not Available

Quantarium does not have data for the current month. Please view the chart for historical values.

Average Value
Not Available
List Price
Sold Price
Create a Home Valuation Report for This Property
The Home Valuation Report is an in-depth analysis detailing your home's value as well as a comparison with similar homes in the area

Home Values in the Area

Source: Public Records

Average Home Value in this Area


Source: Public Records

Purchase History

Date Buyer Sale Price Title Company
Olney Sondra -- Stewart Title
Pelton Jordan J -- First American Title
Israelsen Kyle -- Associated Title Company
Source: Public Records

Mortgage History

Date Status Borrower Loan Amount
Open Olney Sondra $113,200
Previous Owner Pelton Jordan J $123,436
Previous Owner Pelton Jordan J $127,000
Previous Owner Israelsen Kyle $32,510
Source: Public Records

Tax History Compared to Growth

Source: Public Records

Tax History

Year Tax Paid Tax Assessment Tax Assessment Total Assessment is a certain percentage of the fair market value that is determined by local assessors to be the total taxable value of land and additions on the property. Land Improvement
2024 $1,378 $145,750 $30,800 $114,950
2023 $1,400 $261,000 $0 $261,000
2022 $1,424 $144,100 $30,800 $113,300
2021 $1,265 $191,000 $43,000 $148,000
2020 $1,146 $166,000 $39,800 $126,200
2019 $1,128 $160,000 $38,300 $121,700
2018 $997 $142,000 $20,000 $122,000
2016 $899 $66,000 $11,000 $55,000
2015 $921 $64,240 $11,000 $53,240
2014 $883 $62,925 $18,333 $44,592
2013 -- $63,344 $12,650 $50,694
Source: Public Records

Map