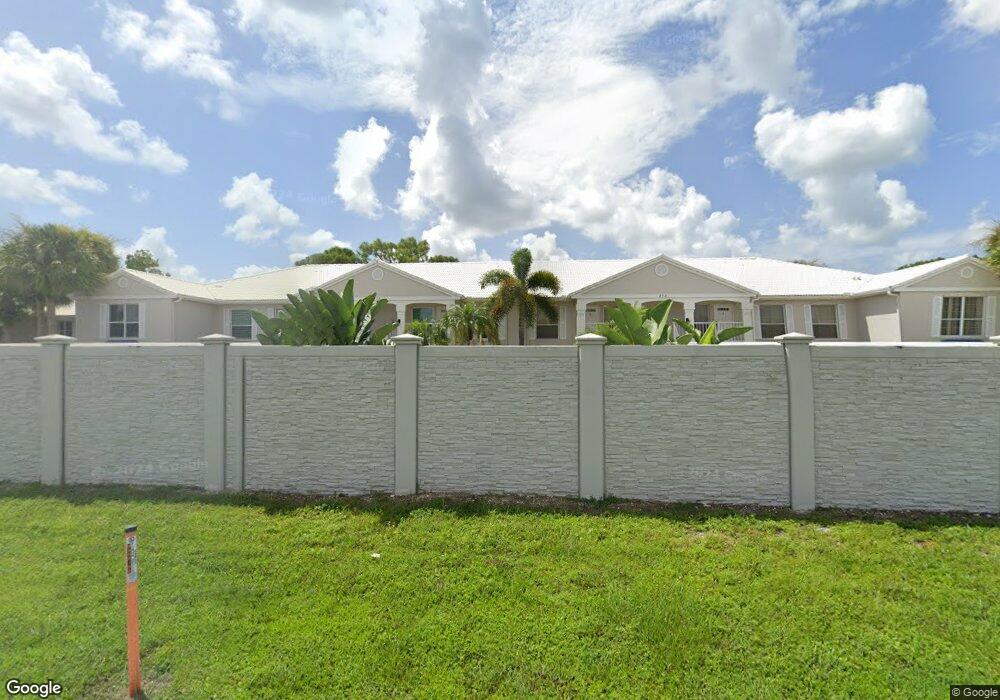
876 Gulf Pavillion Dr Unit 101 Naples, FL 34108
Pelican Bay NeighborhoodEstimated Value: $550,121
3
Beds
2
Baths
1,667
Sq Ft
$330/Sq Ft
Est. Value
About This Home
This home is located at 876 Gulf Pavillion Dr Unit 101, Naples, FL 34108 and is currently priced at $550,121, approximately $330 per square foot. 876 Gulf Pavillion Dr Unit 101 is a home located in Collier County with nearby schools including Naples Park Elementary School, Pine Ridge Middle School, and The Village School.
Ownership History
Date
Name
Owned For
Owner Type
Purchase Details
Closed on
Sep 30, 2020
Sold by
Torre Pascual Della and Della Torre Elsa
Bought by
Whitaker Keith A and Whitaker Teri L
Current Estimated Value
Purchase Details
Closed on
Aug 20, 2001
Sold by
Kennedy Arthur J
Bought by
Torre Pascual Della and Torre Elsa Della
Home Financials for this Owner
Home Financials are based on the most recent Mortgage that was taken out on this home.
Original Mortgage
$105,000
Interest Rate
7.18%
Mortgage Type
New Conventional
Purchase Details
Closed on
Mar 3, 1999
Sold by
Murphy Ronald James and Murphy Jane Callis
Bought by
Kennedy Arthur J
Home Financials for this Owner
Home Financials are based on the most recent Mortgage that was taken out on this home.
Original Mortgage
$104,500
Interest Rate
6.79%
Mortgage Type
Purchase Money Mortgage
Create a Home Valuation Report for This Property
The Home Valuation Report is an in-depth analysis detailing your home's value as well as a comparison with similar homes in the area
Home Values in the Area
Average Home Value in this Area
Purchase History
| Date | Buyer | Sale Price | Title Company |
|---|---|---|---|
| Whitaker Keith A | $280,000 | None Available | |
| Torre Pascual Della | $173,000 | -- | |
| Kennedy Arthur J | $110,000 | -- |
Source: Public Records
Mortgage History
| Date | Status | Borrower | Loan Amount |
|---|---|---|---|
| Previous Owner | Torre Pascual Della | $105,000 | |
| Previous Owner | Kennedy Arthur J | $104,500 |
Source: Public Records
Tax History Compared to Growth
Tax History
| Year | Tax Paid | Tax Assessment Tax Assessment Total Assessment is a certain percentage of the fair market value that is determined by local assessors to be the total taxable value of land and additions on the property. | Land | Improvement |
|---|---|---|---|---|
| 2025 | $3,593 | $426,069 | -- | -- |
| 2024 | $3,562 | $414,061 | -- | -- |
| 2023 | $3,562 | $402,001 | $0 | $0 |
| 2022 | $3,673 | $390,292 | $0 | $390,292 |
| 2021 | $2,541 | $232,656 | $0 | $232,656 |
| 2020 | $2,398 | $221,720 | $0 | $221,720 |
| 2019 | $2,490 | $228,555 | $0 | $228,555 |
| 2018 | $2,486 | $228,555 | $0 | $228,555 |
| 2017 | $2,478 | $223,621 | $0 | $0 |
| 2016 | $2,253 | $203,292 | $0 | $0 |
| 2015 | $2,057 | $184,811 | $0 | $0 |
| 2014 | $1,937 | $172,040 | $0 | $0 |
Source: Public Records
Map
Nearby Homes
- 876 Gulf Pavilion Dr Unit 101
- 876 Gulf Pavilion Dr Unit 105
- 833 91st Ave N
- 834 Gulf Pavilion Dr Unit 201
- 821 Gulf Pavilion Dr Unit 204
- 818 93rd Ave N
- 825 93rd Ave N
- 864 94th Ave N
- 361-4 Vanderbilt Beach Rd
- 1109 Egrets Walk Cir Unit 104
- 1319 Egrets Landing Unit 204
- 770 93rd Ave N
- 1211 Egrets Landing Unit 202
- 9115 Strada Place Unit 5505
- 9115 Strada Place Unit 5414
- 9115 Strada Place Unit 5317
- 9115 Strada Place Unit 5502
- 9115 Strada Place Unit 5416
- 9115 Strada Place Unit 5411
- 9115 Strada Place Unit 5312
- 876 Gulf Pavillion Dr Unit 205
- 876 Gulf Pavillion Dr
- 876 Gulf Pavillion Dr Unit 105
- 876 Gulf Pavillion Dr Unit 104
- 876 Pavilion Dr Unit 102
- 876 Gulf Pavilion Dr
- 876 Gulf Pavilion Dr Unit 206
- 876 Gulf Pavilion Dr Unit 204
- 876 Gulf Pavilion Dr Unit 203
- 876 Gulf Pavilion Dr Unit 202
- 876 Gulf Pavilion Dr Unit 106
- 876 Gulf Pavilion Dr Unit 102
- 876 Gulf Pavilion Dr Unit 205
- 876 Gulf Pavilion Dr Unit 104
- 876 Gulf Pavilion Dr Unit 103
- 881 Gulf Pavillion Dr Unit 204
- 881 Gulf Pavillion Dr Unit 203
- 881 Gulf Pavillion Dr Unit 202
- 881 Gulf Pavillion Dr Unit 201
- 881 Gulf Pavillion Dr Unit 104