Estimated Value: $297,000 - $336,000
5
Beds
3
Baths
2,613
Sq Ft
$122/Sq Ft
Est. Value
About This Home
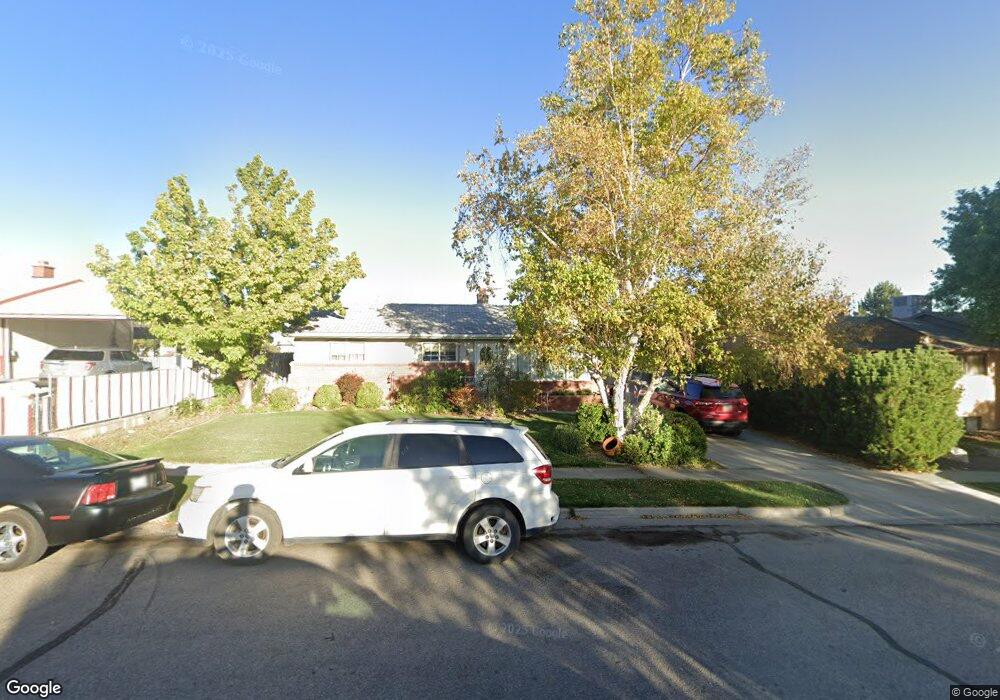
This home is located at 876 N 700 E, Price, UT 84501 and is currently estimated at $317,619, approximately $121 per square foot. 876 N 700 E is a home located in Carbon County with nearby schools including Castle Heights School, Mont Harmon Junior High School, and Carbon High School.
Ownership History
Date
Name
Owned For
Owner Type
Purchase Details
Closed on
Dec 17, 2020
Sold by
Clark Jeremy L and Clark Anneliese P
Bought by
Clark Anneliese P and Clark Jeremy L
Current Estimated Value
Home Financials for this Owner
Home Financials are based on the most recent Mortgage that was taken out on this home.
Original Mortgage
$187,800
Outstanding Balance
$166,813
Interest Rate
2.7%
Mortgage Type
New Conventional
Estimated Equity
$150,807
Purchase Details
Closed on
Aug 21, 2015
Sold by
Jensen David K and Knaphus Jensen Patricia
Bought by
Clark Jeremy L and Clark Anneliese P
Home Financials for this Owner
Home Financials are based on the most recent Mortgage that was taken out on this home.
Original Mortgage
$195,395
Interest Rate
4.25%
Mortgage Type
FHA
Purchase Details
Closed on
Aug 15, 2011
Sold by
Dinkelman Gary J and Dinkelman Linda M
Bought by
Jensen David K and Knaphus Jensen Patricia
Purchase Details
Closed on
Feb 15, 2010
Sold by
Dinkelman Gary J and Dinkelman Linda M
Bought by
Dinkelman Gary J and Dinkelman Linda M
Create a Home Valuation Report for This Property
The Home Valuation Report is an in-depth analysis detailing your home's value as well as a comparison with similar homes in the area
Home Values in the Area
Average Home Value in this Area
Purchase History
| Date | Buyer | Sale Price | Title Company |
|---|---|---|---|
| Clark Anneliese P | -- | Vanguard Title Ins Agcy Llc | |
| Clark Jeremy L | -- | South Eastern Utah Title Co | |
| Jensen David K | -- | -- | |
| Dinkelman Gary J | -- | None Available |
Source: Public Records
Mortgage History
| Date | Status | Borrower | Loan Amount |
|---|---|---|---|
| Open | Clark Anneliese P | $187,800 | |
| Closed | Clark Jeremy L | $195,395 |
Source: Public Records
Tax History Compared to Growth
Tax History
| Year | Tax Paid | Tax Assessment Tax Assessment Total Assessment is a certain percentage of the fair market value that is determined by local assessors to be the total taxable value of land and additions on the property. | Land | Improvement |
|---|---|---|---|---|
| 2025 | $1,745 | $143,660 | $14,998 | $128,662 |
| 2024 | $1,532 | $127,555 | $13,612 | $113,943 |
| 2023 | $1,515 | $134,491 | $13,279 | $121,212 |
| 2022 | $1,581 | $125,929 | $11,041 | $114,888 |
| 2021 | $1,361 | $168,237 | $16,869 | $151,368 |
| 2020 | $1,336 | $82,863 | $0 | $0 |
| 2019 | $1,189 | $77,367 | $0 | $0 |
| 2018 | $1,180 | $78,333 | $0 | $0 |
| 2017 | $1,166 | $78,333 | $0 | $0 |
| 2016 | $1,051 | $78,333 | $0 | $0 |
| 2015 | $1,051 | $78,333 | $0 | $0 |
| 2014 | $1,044 | $78,333 | $0 | $0 |
| 2013 | $1,175 | $87,317 | $0 | $0 |
Source: Public Records
Map
Nearby Homes