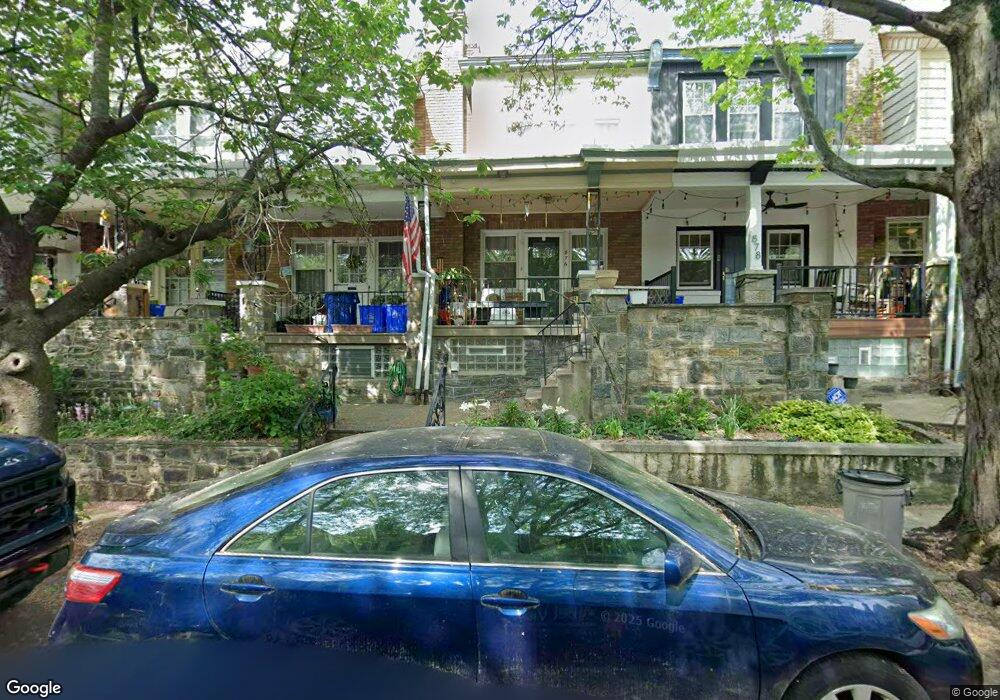
876 N Woodstock St Philadelphia, PA 19130
Fairmount NeighborhoodEstimated Value: $482,000 - $518,798
3
Beds
1
Bath
1,200
Sq Ft
$414/Sq Ft
Est. Value
About This Home
This home is located at 876 N Woodstock St, Philadelphia, PA 19130 and is currently estimated at $496,950, approximately $414 per square foot. 876 N Woodstock St is a home located in Philadelphia County with nearby schools including Bache-Martin School, Benjamin Franklin High School, and The City School-Fairmount Campus.
Ownership History
Date
Name
Owned For
Owner Type
Purchase Details
Closed on
Mar 30, 2016
Sold by
Trinidad Raul T
Bought by
Trindad Raul T and Trindad Margaret
Current Estimated Value
Home Financials for this Owner
Home Financials are based on the most recent Mortgage that was taken out on this home.
Original Mortgage
$166,000
Outstanding Balance
$131,703
Interest Rate
3.64%
Mortgage Type
Construction
Estimated Equity
$365,247
Purchase Details
Closed on
Mar 24, 2016
Sold by
Tr4indad Ruben and Trindad Sonja Miare
Bought by
Trindad Raul T
Home Financials for this Owner
Home Financials are based on the most recent Mortgage that was taken out on this home.
Original Mortgage
$166,000
Outstanding Balance
$131,703
Interest Rate
3.64%
Mortgage Type
Construction
Estimated Equity
$365,247
Purchase Details
Closed on
Jan 14, 2016
Sold by
Ronsayro Dina S and Estate Of Cornella T Trindad
Bought by
Trinidad Raul T and Trinidad R5uben
Purchase Details
Closed on
Feb 24, 1978
Bought by
Cornelia Mario R and Cornelia Trinidad
Create a Home Valuation Report for This Property
The Home Valuation Report is an in-depth analysis detailing your home's value as well as a comparison with similar homes in the area
Home Values in the Area
Average Home Value in this Area
Purchase History
| Date | Buyer | Sale Price | Title Company |
|---|---|---|---|
| Trindad Raul T | -- | Navy Federal Title Services | |
| Trindad Raul T | $100,000 | Navy Federal Title Services | |
| Trinidad Raul T | -- | None Available | |
| Cornelia Mario R | $40,000 | -- |
Source: Public Records
Mortgage History
| Date | Status | Borrower | Loan Amount |
|---|---|---|---|
| Open | Trindad Raul T | $166,000 | |
| Closed | Trindad Raul T | $166,000 |
Source: Public Records
Tax History Compared to Growth
Tax History
| Year | Tax Paid | Tax Assessment Tax Assessment Total Assessment is a certain percentage of the fair market value that is determined by local assessors to be the total taxable value of land and additions on the property. | Land | Improvement |
|---|---|---|---|---|
| 2025 | $5,790 | $490,800 | $98,160 | $392,640 |
| 2024 | $5,790 | $490,800 | $98,160 | $392,640 |
| 2023 | $5,790 | $413,600 | $82,720 | $330,880 |
| 2022 | $4,890 | $368,600 | $82,720 | $285,880 |
| 2021 | $5,519 | $0 | $0 | $0 |
| 2020 | $5,519 | $0 | $0 | $0 |
| 2019 | $5,342 | $0 | $0 | $0 |
| 2018 | $4,395 | $0 | $0 | $0 |
| 2017 | $4,395 | $0 | $0 | $0 |
| 2016 | $30,681 | $0 | $0 | $0 |
| 2015 | $30,681 | $0 | $0 | $0 |
| 2014 | -- | $314,000 | $54,672 | $259,328 |
| 2012 | -- | $22,336 | $5,372 | $16,964 |
Source: Public Records
Map
Nearby Homes
- 881 N Beechwood St
- 862 N Beechwood St
- 882 N Woodstock St
- 827 Corinthian Ave
- 2022 Ogden St
- 835 N Capitol St
- 879 N Judson St
- 864 N Judson St
- 871 N 20th St Unit 1
- 808 N Judson St
- 1929 W George St
- 870 N Bucknell St
- 1926 Poplar St Unit 1
- 2314 Brown St
- 747 N Capitol St
- 2019 W Girard Ave
- 741 N Capitol St
- 739 N Capitol St
- 925 N 20th St
- 1932 Cambridge St Unit A
- 878 N Woodstock St
- 874 N Woodstock St
- 880 N Woodstock St
- 872 N Woodstock St
- 870 N Woodstock St
- 884 N Woodstock St
- 868 N Woodstock St
- 886 N Woodstock St
- 866 N Woodstock St
- 877 N 21st St
- 875 N 21st St
- 871 N 21st St
- 873 N 21st St
- 879 N 21st St
- 881 N 21st St
- 864 N Woodstock St
- 869 N 21st St
- 888 N Woodstock St
- 883 N 21st St
- 867 N 21st St