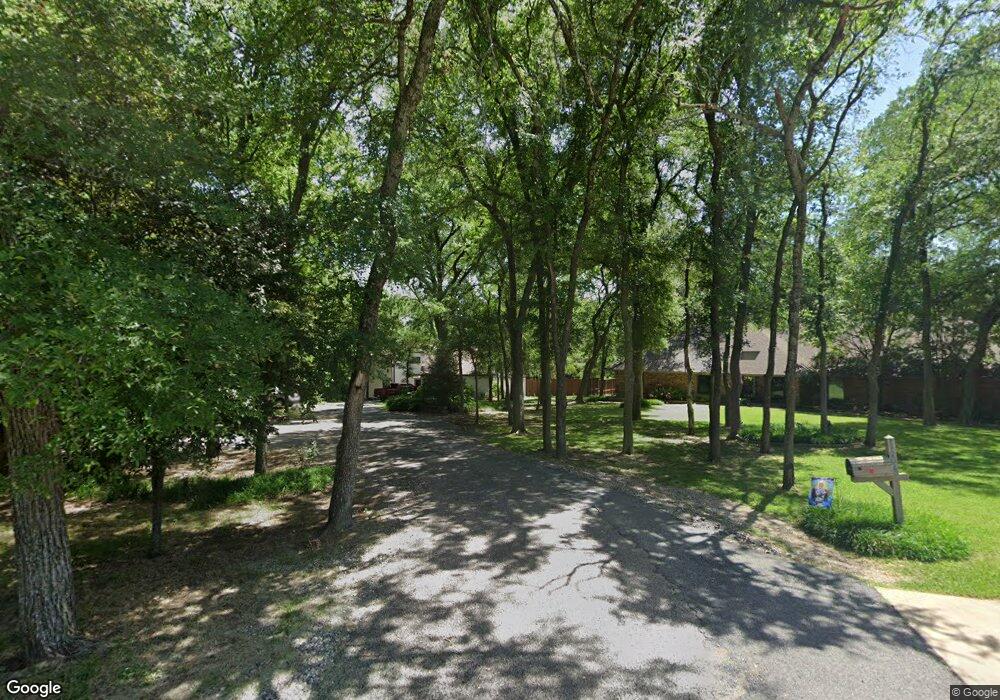
876 Norwood Rd Sherman, TX 75092
Estimated Value: $480,000 - $533,000
--
Bed
--
Bath
3,056
Sq Ft
$168/Sq Ft
Est. Value
About This Home
This home is located at 876 Norwood Rd, Sherman, TX 75092 and is currently estimated at $512,044, approximately $167 per square foot. 876 Norwood Rd is a home located in Grayson County with nearby schools including S&S Consolidated Elementary School, S&S Consolidated Middle School, and S. & S. Cons H.S..
Ownership History
Date
Name
Owned For
Owner Type
Purchase Details
Closed on
Dec 22, 2020
Sold by
Reed Waymon B and Reed Shannon
Bought by
Munson Tamara L
Current Estimated Value
Home Financials for this Owner
Home Financials are based on the most recent Mortgage that was taken out on this home.
Original Mortgage
$337,565
Outstanding Balance
$301,069
Interest Rate
2.8%
Mortgage Type
FHA
Estimated Equity
$210,975
Purchase Details
Closed on
Aug 19, 2019
Sold by
Durham John F and Durham Joy A
Bought by
Reed Waymon B and Reed Shannon
Purchase Details
Closed on
Jan 4, 2017
Sold by
Stevenson Henry F and Stevenson Shirley Ann
Bought by
Durham John F and Durham Joy A
Home Financials for this Owner
Home Financials are based on the most recent Mortgage that was taken out on this home.
Original Mortgage
$272,000
Interest Rate
4.03%
Mortgage Type
New Conventional
Create a Home Valuation Report for This Property
The Home Valuation Report is an in-depth analysis detailing your home's value as well as a comparison with similar homes in the area
Home Values in the Area
Average Home Value in this Area
Purchase History
| Date | Buyer | Sale Price | Title Company |
|---|---|---|---|
| Munson Tamara L | -- | None Available | |
| Reed Waymon B | -- | None Available | |
| Durham John F | -- | None Available |
Source: Public Records
Mortgage History
| Date | Status | Borrower | Loan Amount |
|---|---|---|---|
| Open | Munson Tamara L | $337,565 | |
| Previous Owner | Durham John F | $272,000 |
Source: Public Records
Tax History Compared to Growth
Tax History
| Year | Tax Paid | Tax Assessment Tax Assessment Total Assessment is a certain percentage of the fair market value that is determined by local assessors to be the total taxable value of land and additions on the property. | Land | Improvement |
|---|---|---|---|---|
| 2025 | $6,715 | $445,800 | -- | -- |
| 2024 | $8,094 | $405,273 | $0 | $0 |
| 2023 | $6,030 | $368,430 | $0 | $0 |
| 2022 | $7,193 | $334,936 | $0 | $0 |
| 2021 | $7,266 | $304,487 | $62,631 | $241,856 |
| 2020 | $7,634 | $312,173 | $62,631 | $249,542 |
| 2019 | $5,990 | $301,905 | $46,104 | $255,801 |
| 2018 | $5,062 | $270,107 | $13,954 | $256,153 |
| 2017 | $4,564 | $265,604 | $13,954 | $251,650 |
| 2016 | $4,149 | $194,789 | $13,954 | $180,835 |
| 2015 | $1,616 | $164,641 | $13,954 | $150,687 |
| 2014 | $1,692 | $145,944 | $13,954 | $131,990 |
Source: Public Records
Map
Nearby Homes
- 2705 Spring Lake Dr
- 1913 Heritage Knoll Dr
- 1912 Heritage Knoll Dr
- 1720 Heritage Knoll Dr
- 2802 Spring Lake Dr
- 2710 Stonecrest Dr
- 2714 Stonecrest Dr
- 1706 Norwood St
- 2715 Stonecrest Dr
- 2806 Spring Lake Dr
- 2910 Wellington Dr
- 1809 Heritage Creek Dr
- 1605 Heritage Creek Dr
- 302 Asterwood Ln
- 3716 Spring Run Dr
- 314 Asterwood Ln
- 3613 Oleander Place
- 3712 Spring Run Dr
- 3715 Oleander Place
- 3707 Oleander Place
- 1600 Norwood St
- 1604 Norwood St
- 873 Norwood Rd
- 1608 Norwood St
- 857 Norwood Rd
- 994 Carriage Estates Rd
- 982 Carriage Estates Rd
- 1612 Norwood St
- 1612 Norwood St
- 942 Carriage Estates Rd
- 1602 Carriage Estates Rd
- 1602 Carriage Estates Rd
- 1616 Norwood St
- 807 Norwood Rd Unit A
- 912 Carriage Estates Rd
- 2709 Spring Lake Dr
- 1610 Carriage Estates Rd
- 973 Carriage Estates Rd
- 2721 Stonecrest Dr
- 2718 Stonecrest Dr