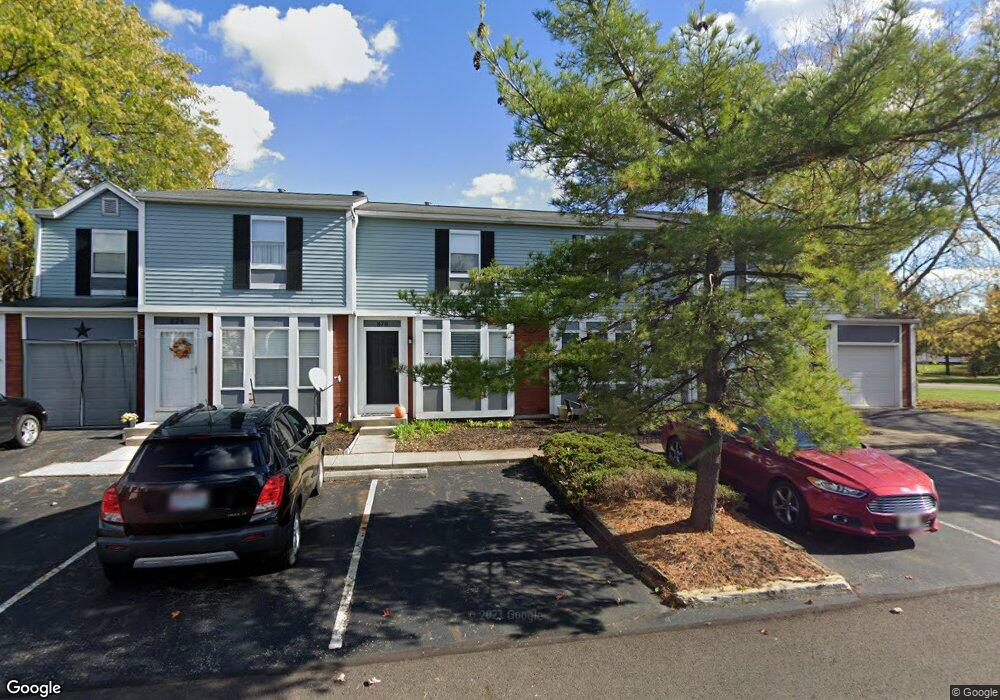
876 Pineway Dr Columbus, OH 43085
Slate Hill NeighborhoodEstimated Value: $192,336 - $205,000
2
Beds
2
Baths
816
Sq Ft
$244/Sq Ft
Est. Value
About This Home
This home is located at 876 Pineway Dr, Columbus, OH 43085 and is currently estimated at $199,334, approximately $244 per square foot. 876 Pineway Dr is a home located in Franklin County with nearby schools including Worthington Estates Elementary School, Worthingway Middle School, and Thomas Worthington High School.
Ownership History
Date
Name
Owned For
Owner Type
Purchase Details
Closed on
Nov 13, 2013
Sold by
Abdel Latif Mohamed
Bought by
Ehrbar Katherine M
Current Estimated Value
Home Financials for this Owner
Home Financials are based on the most recent Mortgage that was taken out on this home.
Original Mortgage
$76,950
Outstanding Balance
$56,703
Interest Rate
4.24%
Mortgage Type
New Conventional
Estimated Equity
$142,631
Purchase Details
Closed on
Oct 11, 2013
Sold by
Ramadan Salwa T
Bought by
Abdel Latif Mohamed
Home Financials for this Owner
Home Financials are based on the most recent Mortgage that was taken out on this home.
Original Mortgage
$76,950
Outstanding Balance
$56,703
Interest Rate
4.24%
Mortgage Type
New Conventional
Estimated Equity
$142,631
Purchase Details
Closed on
Feb 13, 1998
Sold by
Ramadan Salwa R
Bought by
Abdel Latif Mohamed and Ramadan Salwa T
Purchase Details
Closed on
Sep 26, 1996
Sold by
Bryant Roxanna J
Bought by
Ramadan Salma T
Purchase Details
Closed on
Jan 4, 1994
Create a Home Valuation Report for This Property
The Home Valuation Report is an in-depth analysis detailing your home's value as well as a comparison with similar homes in the area
Home Values in the Area
Average Home Value in this Area
Purchase History
| Date | Buyer | Sale Price | Title Company |
|---|---|---|---|
| Ehrbar Katherine M | $81,000 | Talon Title D | |
| Abdel Latif Mohamed | -- | None Available | |
| Abdel Latif Mohamed | -- | -- | |
| Ramadan Salma T | $38,000 | -- | |
| -- | -- | -- |
Source: Public Records
Mortgage History
| Date | Status | Borrower | Loan Amount |
|---|---|---|---|
| Open | Ehrbar Katherine M | $76,950 |
Source: Public Records
Tax History
| Year | Tax Paid | Tax Assessment Tax Assessment Total Assessment is a certain percentage of the fair market value that is determined by local assessors to be the total taxable value of land and additions on the property. | Land | Improvement |
|---|---|---|---|---|
| 2025 | $3,209 | $52,260 | $14,350 | $37,910 |
| 2024 | $3,209 | $52,260 | $14,350 | $37,910 |
| 2023 | $3,068 | $52,260 | $14,350 | $37,910 |
| 2022 | $2,629 | $35,530 | $4,410 | $31,120 |
| 2021 | $2,425 | $35,530 | $4,410 | $31,120 |
| 2020 | $2,336 | $35,530 | $4,410 | $31,120 |
| 2019 | $2,158 | $29,620 | $3,680 | $25,940 |
| 2018 | $1,843 | $29,620 | $3,680 | $25,940 |
| 2017 | $1,934 | $29,620 | $3,680 | $25,940 |
| 2016 | $1,595 | $22,470 | $3,780 | $18,690 |
| 2015 | $1,596 | $22,470 | $3,780 | $18,690 |
| 2014 | $1,595 | $22,470 | $3,780 | $18,690 |
| 2013 | $839 | $23,765 | $4,200 | $19,565 |
Source: Public Records
Map
Nearby Homes
- 888 Annagladys Dr Unit F4
- 910 Annagladys Dr Unit G2
- 818 Annagladys Dr Unit A2
- 994 Annagladys Dr Unit M4
- 7685 Whitneyway Dr Unit 17
- 7712 Barkwood Dr Unit 3B
- 7760 Gorman Dr Unit 235
- 717 Alta View Ct Unit 28
- 0 Sancus Blvd
- 836 Noddymill Ln W Unit 42C
- 7853 Barkwood Dr Unit 18C
- 579 Mawyer Dr Unit 168
- 7882 Barkwood Dr Unit 20D
- 7902 Woodhouse Ln Unit 47B
- 7921 Chetenham Dr
- 1212 Tillicum Dr
- 7852 Heathcock Ct
- 8100 Treebrook Ln
- 1263 Freshman Dr
- 8105 Storrow Dr
- 876 Pine Way Dr
- 876 Pine Way Dr Unit G-2
- 878 Pine Way Dr Unit G3
- 878 Pineway Dr
- 874 Pine Way Dr Unit G1
- 874 Pine Way Dr Unit 1
- 874 Pineway Dr
- 880 Pineway Dr Unit G-4
- 880 Pineway Dr
- 880 Pine Way Dr Unit G4
- 892 Worthington Blvd Unit A2
- 892 Worthington Woods Blvd
- 890 Worthington Woods Blvd
- 890 Worthington Woods Blvd
- 890 Worthington Woods Blvd Unit 1
- 894 Worthington Blvd Unit 3A
- 894 Worthington Woods Blvd
- 894 Worthington Woods Blvd Unit A
- 894 Worthington Woods Blvd Unit 3
- 868 Pine Way Dr
Your Personal Tour Guide
Ask me questions while you tour the home.