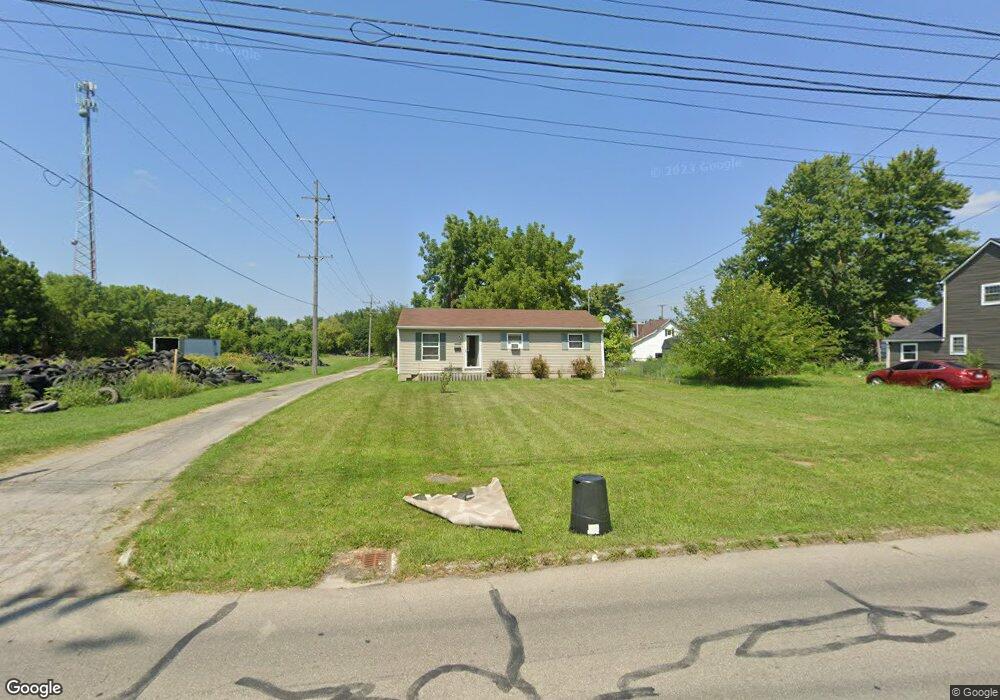
876 Silver St Marion, OH 43302
Estimated Value: $92,000 - $113,000
3
Beds
1
Bath
960
Sq Ft
$104/Sq Ft
Est. Value
About This Home
This home is located at 876 Silver St, Marion, OH 43302 and is currently estimated at $99,691, approximately $103 per square foot. 876 Silver St is a home located in Marion County with nearby schools including Rutherford B. Hayes Elementary School, Ulysses S. Grant Middle School, and Harding High School.
Ownership History
Date
Name
Owned For
Owner Type
Purchase Details
Closed on
Oct 26, 2016
Sold by
Loan Tree Investments Llc
Bought by
Kin-As Properties Llc
Current Estimated Value
Home Financials for this Owner
Home Financials are based on the most recent Mortgage that was taken out on this home.
Original Mortgage
$119,756
Outstanding Balance
$64,157
Interest Rate
3.5%
Mortgage Type
Seller Take Back
Estimated Equity
$35,534
Purchase Details
Closed on
Oct 29, 2015
Sold by
D R Investments Ltd
Bought by
Gelenalan Llc
Purchase Details
Closed on
Nov 9, 2004
Bought by
Gelenalan Llc
Purchase Details
Closed on
May 31, 2002
Bought by
Gelenalan Llc
Purchase Details
Closed on
May 25, 2002
Bought by
Gelenalan Llc
Purchase Details
Closed on
Aug 22, 2001
Bought by
Gelenalan Llc
Purchase Details
Closed on
Mar 24, 1994
Bought by
Gelenalan Llc
Create a Home Valuation Report for This Property
The Home Valuation Report is an in-depth analysis detailing your home's value as well as a comparison with similar homes in the area
Home Values in the Area
Average Home Value in this Area
Purchase History
| Date | Buyer | Sale Price | Title Company |
|---|---|---|---|
| Kin-As Properties Llc | $115,400 | Attorney | |
| Loan Tree Investments Llc | $5,000 | Attorney | |
| Gelenalan Llc | $13,334 | Attorney | |
| Gelenalan Llc | -- | -- | |
| Gelenalan Llc | $62,000 | -- | |
| Gelenalan Llc | $5,000 | -- | |
| Gelenalan Llc | -- | -- | |
| Gelenalan Llc | $800 | -- |
Source: Public Records
Mortgage History
| Date | Status | Borrower | Loan Amount |
|---|---|---|---|
| Open | Kin-As Properties Llc | $119,756 |
Source: Public Records
Tax History
| Year | Tax Paid | Tax Assessment Tax Assessment Total Assessment is a certain percentage of the fair market value that is determined by local assessors to be the total taxable value of land and additions on the property. | Land | Improvement |
|---|---|---|---|---|
| 2025 | $928 | $25,680 | $2,170 | $23,510 |
| 2024 | $928 | $20,570 | $2,090 | $18,480 |
| 2023 | $928 | $20,570 | $2,090 | $18,480 |
| 2022 | $734 | $20,570 | $2,090 | $18,480 |
| 2021 | $635 | $16,040 | $1,820 | $14,220 |
| 2020 | $637 | $16,040 | $1,820 | $14,220 |
| 2019 | $637 | $16,040 | $1,820 | $14,220 |
| 2018 | $560 | $14,100 | $1,780 | $12,320 |
| 2017 | $567 | $14,100 | $1,780 | $12,320 |
| 2016 | $563 | $14,100 | $1,780 | $12,320 |
| 2015 | $562 | $13,780 | $1,700 | $12,080 |
| 2014 | $922 | $13,780 | $1,700 | $12,080 |
| 2012 | $644 | $15,660 | $1,860 | $13,800 |
Source: Public Records
Map
Nearby Homes
Your Personal Tour Guide
Ask me questions while you tour the home.