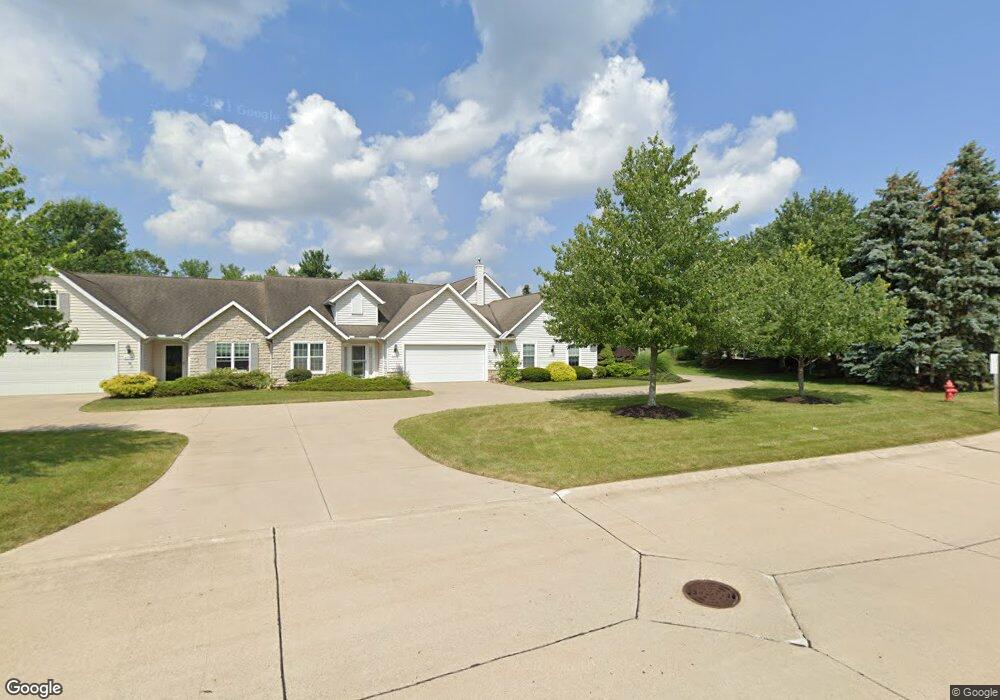
8762 Morgans Run Unit 1C Olmsted Falls, OH 44138
Estimated Value: $236,457 - $237,000
2
Beds
3
Baths
1,835
Sq Ft
$129/Sq Ft
Est. Value
About This Home
This home is located at 8762 Morgans Run Unit 1C, Olmsted Falls, OH 44138 and is currently estimated at $236,729, approximately $129 per square foot. 8762 Morgans Run Unit 1C is a home located in Cuyahoga County with nearby schools including Falls-Lenox Primary Elementary School, Olmsted Falls Intermediate Building, and Olmsted Falls Middle School.
Ownership History
Date
Name
Owned For
Owner Type
Purchase Details
Closed on
Aug 30, 2022
Sold by
Donahue Kelly
Bought by
Mcholland Brian S
Current Estimated Value
Home Financials for this Owner
Home Financials are based on the most recent Mortgage that was taken out on this home.
Original Mortgage
$196,377
Outstanding Balance
$188,862
Interest Rate
6.13%
Mortgage Type
FHA
Estimated Equity
$47,867
Purchase Details
Closed on
May 30, 2019
Sold by
Herman Family Trust
Bought by
Donahue Kelly
Purchase Details
Closed on
Nov 22, 2005
Sold by
Jardine Michelene H and Jardine Guy A
Bought by
Herman Bernard and Herman Dorothy M
Home Financials for this Owner
Home Financials are based on the most recent Mortgage that was taken out on this home.
Original Mortgage
$103,000
Interest Rate
6.17%
Mortgage Type
Fannie Mae Freddie Mac
Create a Home Valuation Report for This Property
The Home Valuation Report is an in-depth analysis detailing your home's value as well as a comparison with similar homes in the area
Home Values in the Area
Average Home Value in this Area
Purchase History
| Date | Buyer | Sale Price | Title Company |
|---|---|---|---|
| Mcholland Brian S | $200,000 | Black Tie Title | |
| Donahue Kelly | -- | None Available | |
| Herman Bernard | $164,000 | Real Living Title Agency L |
Source: Public Records
Mortgage History
| Date | Status | Borrower | Loan Amount |
|---|---|---|---|
| Open | Mcholland Brian S | $196,377 | |
| Previous Owner | Herman Bernard | $103,000 |
Source: Public Records
Tax History Compared to Growth
Tax History
| Year | Tax Paid | Tax Assessment Tax Assessment Total Assessment is a certain percentage of the fair market value that is determined by local assessors to be the total taxable value of land and additions on the property. | Land | Improvement |
|---|---|---|---|---|
| 2024 | $4,625 | $70,000 | $7,910 | $62,090 |
| 2023 | $4,856 | $60,660 | $6,090 | $54,570 |
| 2022 | $4,908 | $60,660 | $6,090 | $54,570 |
| 2021 | $4,862 | $60,660 | $6,090 | $54,570 |
| 2020 | $4,607 | $50,960 | $5,110 | $45,850 |
| 2019 | $4,102 | $145,600 | $14,600 | $131,000 |
| 2018 | $4,011 | $50,960 | $5,110 | $45,850 |
| 2017 | $3,170 | $36,650 | $4,730 | $31,920 |
| 2016 | $3,152 | $36,650 | $4,730 | $31,920 |
| 2015 | $3,556 | $36,650 | $4,730 | $31,920 |
| 2014 | $3,556 | $40,710 | $5,250 | $35,460 |
Source: Public Records
Map
Nearby Homes
- 8757 Roberts Ct Unit 25C
- 396 Crossbrook Dr
- 8241 Lewis Rd
- 549 Wyleswood Dr
- 543 Wyleswood Dr
- 537 Wyleswood Dr
- Anderson Plan at Smokestack Trails
- Bramante Ranch Plan at Smokestack Trails
- Hudson Plan at Smokestack Trails
- Columbia Plan at Smokestack Trails
- Lehigh Plan at Smokestack Trails
- 23514 Grist Mill Ct Unit 4
- 0
- 136 River Rock Way Unit D
- 100 River Rock Way
- Caroline Plan at Falls Landing - Villas
- Wexford Plan at Falls Landing - Villas
- Rosecliff Plan at Falls Landing - Villas
- 23390 Wainwright Terrace
- 412 Wyleswood Dr
- 8766 Morgans Run Unit A1
- 8764 Morgans Run Unit 1B
- 8766 Morgans Run Unit 1a
- 8780 Morgan's Run Unit 2C
- 24001 West Rd
- 8782 Morgans Run
- 8780 Morgans Run
- 8784 Morgans Run
- 8782 Morgans Run Unit 2B
- 8780 Morgans Run Unit 2C
- 8784 Morgans Run Unit 2A
- 24069 West Rd
- 8749 Roberts Ct
- 8747 Roberts Ct
- 8747 Roberts Ct Unit 26-A
- 24118 Wilderness Trail
- 24125 West Rd
- 23969 Cottage Trail
- 23917 Cottage Trail
- 8821 Roberts Ct Unit 18A