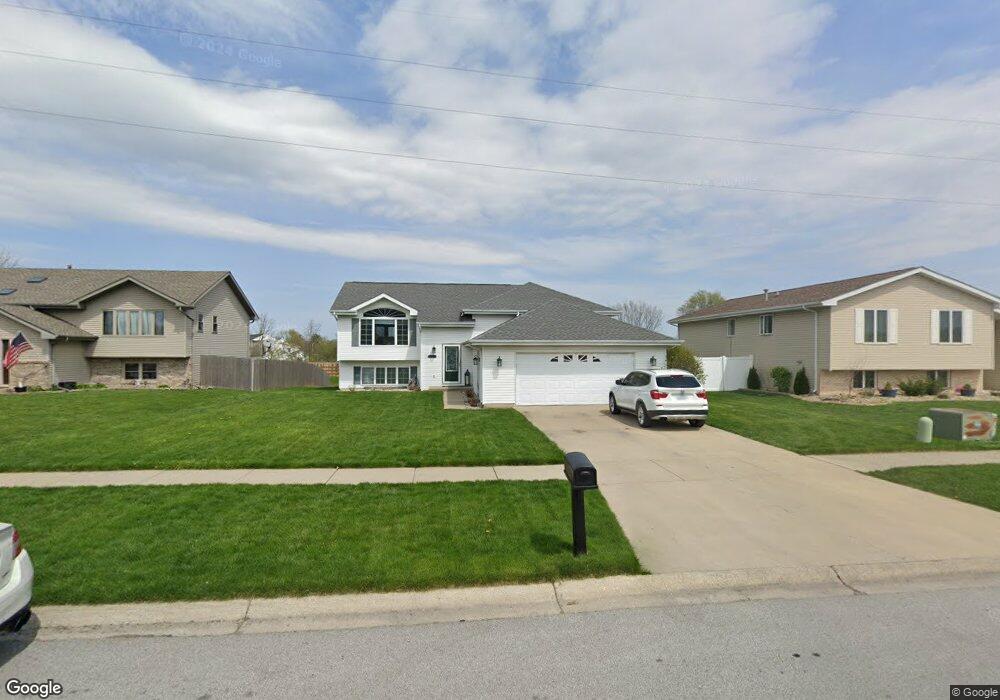
8763 Calhoun Place Crown Point, IN 46307
Estimated Value: $383,521 - $428,000
4
Beds
3
Baths
2,637
Sq Ft
$152/Sq Ft
Est. Value
About This Home
This home is located at 8763 Calhoun Place, Crown Point, IN 46307 and is currently estimated at $401,630, approximately $152 per square foot. 8763 Calhoun Place is a home located in Lake County with nearby schools including Hal E Clark Middle School, Peifer Elementary School, and Lake Central High School.
Ownership History
Date
Name
Owned For
Owner Type
Purchase Details
Closed on
Jun 27, 2022
Sold by
Rains Jeffrey A
Bought by
Town Of Schererville
Current Estimated Value
Purchase Details
Closed on
Feb 16, 2010
Sold by
Cordova Jocelyn V
Bought by
Rains Jeffery A
Home Financials for this Owner
Home Financials are based on the most recent Mortgage that was taken out on this home.
Original Mortgage
$230,743
Interest Rate
5.11%
Mortgage Type
FHA
Purchase Details
Closed on
Aug 31, 2006
Sold by
Hinkel Dennis G and Hinkel Michelle R
Bought by
Cordova Jocelyn V
Home Financials for this Owner
Home Financials are based on the most recent Mortgage that was taken out on this home.
Original Mortgage
$230,000
Interest Rate
6.77%
Mortgage Type
Purchase Money Mortgage
Create a Home Valuation Report for This Property
The Home Valuation Report is an in-depth analysis detailing your home's value as well as a comparison with similar homes in the area
Home Values in the Area
Average Home Value in this Area
Purchase History
| Date | Buyer | Sale Price | Title Company |
|---|---|---|---|
| Town Of Schererville | $3,623 | Austgen Kuiper Jasaitis Pc | |
| Rains Jeffery A | -- | Chicago Title Insurance Co | |
| Cordova Jocelyn V | -- | Ticor Mo |
Source: Public Records
Mortgage History
| Date | Status | Borrower | Loan Amount |
|---|---|---|---|
| Previous Owner | Rains Jeffery A | $230,743 | |
| Previous Owner | Cordova Jocelyn V | $230,000 |
Source: Public Records
Tax History Compared to Growth
Tax History
| Year | Tax Paid | Tax Assessment Tax Assessment Total Assessment is a certain percentage of the fair market value that is determined by local assessors to be the total taxable value of land and additions on the property. | Land | Improvement |
|---|---|---|---|---|
| 2024 | $5,312 | $327,400 | $73,900 | $253,500 |
| 2023 | $2,269 | $321,700 | $73,900 | $247,800 |
| 2022 | $2,269 | $279,400 | $66,200 | $213,200 |
| 2021 | $2,025 | $260,700 | $66,200 | $194,500 |
| 2020 | $2,051 | $257,500 | $57,800 | $199,700 |
| 2019 | $2,140 | $242,200 | $51,900 | $190,300 |
| 2018 | $2,051 | $232,900 | $51,900 | $181,000 |
| 2017 | $1,916 | $230,900 | $51,900 | $179,000 |
| 2016 | $1,677 | $210,600 | $51,900 | $158,700 |
| 2014 | $1,675 | $224,600 | $51,900 | $172,700 |
| 2013 | $1,652 | $221,500 | $51,900 | $169,600 |
Source: Public Records
Map
Nearby Homes
- 6076 Wexford Way
- 8849 Calhoun Place
- 6440 W 89th Ave
- 6501 W 89th Ave
- 8748 Durbin Ln
- 8903 Edison St
- 2921 Morningside Dr
- 6308 W 91st Ave
- 2914 Morningside Dr
- 5547 Maggie Mae Ct
- 4974 W 87th Place
- 8521 Morse Place
- 5544 Maggie Mae Ct
- 9017 Mathews St
- 5063 W 89th Ct
- 4944 W 89th Terrace
- 4930 W 84th Terrace
- 1813 Redwood Ct
- 7403 W 85th Ave
- 1896 Azalea Ct
- 8755 Calhoun Place
- 8735 Calhoun Place
- 8779 Calhoun Place
- 8781 Calhoun Place
- 8723 Calhoun Place
- 8778 Calhoun Place
- 8744 Calhoun Place
- 8758 Calhoun Place
- 8766 Calhoun Place
- 8702 Burr Ridge Cir
- 8787 Calhoun Place
- 8730 Calhoun Place
- 8710 Burr Ridge Cir
- 8686 Burr Ridge Cir
- 6122 W 88th Ave
- 6090 W 88th Ave
- 6146 W 88th Ave
- 8731 King Place
- 8795 Calhoun Place
- 8747 King Place