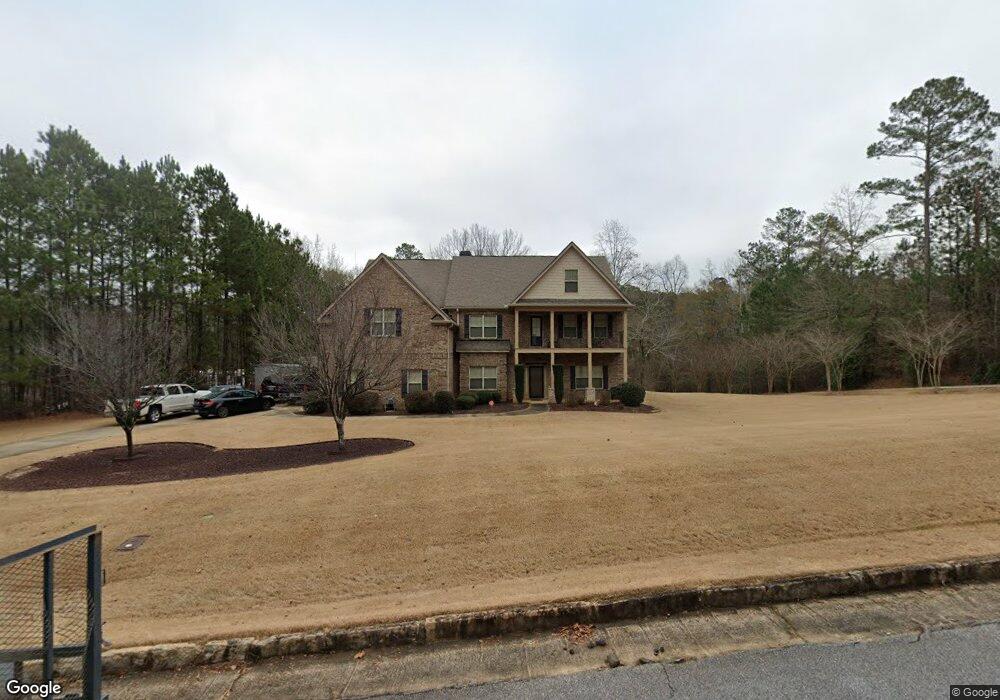
8764 Heiferhorn Way Columbus, GA 31904
Estimated Value: $555,000 - $897,000
6
Beds
5
Baths
5,889
Sq Ft
$121/Sq Ft
Est. Value
About This Home
This home is located at 8764 Heiferhorn Way, Columbus, GA 31904 and is currently estimated at $714,856, approximately $121 per square foot. 8764 Heiferhorn Way is a home located in Muscogee County with nearby schools including Double Churches Elementary School, Veterans Memorial Middle School, and Northside High School.
Ownership History
Date
Name
Owned For
Owner Type
Purchase Details
Closed on
Apr 18, 2012
Sold by
Jeff Lindsey Communities I
Bought by
Jww Investments Llc
Current Estimated Value
Home Financials for this Owner
Home Financials are based on the most recent Mortgage that was taken out on this home.
Original Mortgage
$317,650
Outstanding Balance
$221,668
Interest Rate
4.13%
Mortgage Type
VA
Estimated Equity
$493,188
Purchase Details
Closed on
Sep 23, 2011
Sold by
Jww Investments Llc
Bought by
Jeff Lindsey Communities Inc
Home Financials for this Owner
Home Financials are based on the most recent Mortgage that was taken out on this home.
Original Mortgage
$48,000
Interest Rate
4.3%
Mortgage Type
New Conventional
Purchase Details
Closed on
Jul 14, 2011
Sold by
Dykes Builders Inc
Bought by
Jww Investments Llc
Create a Home Valuation Report for This Property
The Home Valuation Report is an in-depth analysis detailing your home's value as well as a comparison with similar homes in the area
Home Values in the Area
Average Home Value in this Area
Purchase History
| Date | Buyer | Sale Price | Title Company |
|---|---|---|---|
| Jww Investments Llc | -- | -- | |
| Carr Vanessa | $317,650 | -- | |
| Jeff Lindsey Communities Inc | $60,000 | -- | |
| Jww Investments Llc | $375,000 | -- |
Source: Public Records
Mortgage History
| Date | Status | Borrower | Loan Amount |
|---|---|---|---|
| Open | Carr Vanessa | $317,650 | |
| Closed | Jww Investments Llc | $317,650 | |
| Previous Owner | Jeff Lindsey Communities Inc | $48,000 |
Source: Public Records
Tax History Compared to Growth
Tax History
| Year | Tax Paid | Tax Assessment Tax Assessment Total Assessment is a certain percentage of the fair market value that is determined by local assessors to be the total taxable value of land and additions on the property. | Land | Improvement |
|---|---|---|---|---|
| 2025 | $527 | $306,764 | $52,404 | $254,360 |
| 2024 | $715 | $306,764 | $52,404 | $254,360 |
| 2023 | $302 | $306,764 | $52,404 | $254,360 |
| 2022 | $1,369 | $231,540 | $52,404 | $179,136 |
| 2021 | $1,404 | $222,588 | $52,404 | $170,184 |
| 2020 | $1,835 | $222,588 | $52,404 | $170,184 |
| 2019 | $2,034 | $222,588 | $52,404 | $170,184 |
| 2018 | $2,221 | $222,588 | $52,404 | $170,184 |
| 2017 | $4,920 | $222,588 | $52,404 | $170,184 |
| 2016 | $2,808 | $135,283 | $24,000 | $111,283 |
| 2015 | $5,040 | $135,283 | $24,000 | $111,283 |
| 2014 | $5,046 | $135,283 | $24,000 | $111,283 |
| 2013 | -- | $135,283 | $24,000 | $111,283 |
Source: Public Records
Map
Nearby Homes
- 1641 Foxhall Ct
- 8401 Canaan Cir
- 1017 Timber Creek Way
- 8463 Timber Creek Dr
- 8458 Timber Creek Dr
- 8344 Twin Chapel Dr
- 1149 Posey Ln
- 7170 Bridgemill Dr
- 912 Eden St
- Alder Plan at Heiferhorn Farms
- Cannaberra Plan at Heiferhorn Farms
- Spruce Plan at Heiferhorn Farms
- Oakwood Plan at Heiferhorn Farms
- Harrison Plan at Heiferhorn Farms
- Maple Plan at Heiferhorn Farms
- Jackson Plan at Heiferhorn Farms
- Ash II Plan at Heiferhorn Farms
- Aspen Plan at Heiferhorn Farms
- Camden Plan at Heiferhorn Farms
- Belmont Plan at Heiferhorn Farms
- 8772 Heiferhorn Way
- 8740 Heiferhorn Way
- 1085 Heiferhorn Dr
- 8756 Heiferhorn Way
- 8752 Heiferhorn Way
- 8780 Heiferhorn Way
- 8732 Heiferhorn Way
- 8748 Heiferhorn Way
- 1088 Heiferhorn Dr
- 8788 Heiferhorn Way
- 1073 Heiferhorn Dr
- 8744 Heiferhorn Way
- 1076 Heiferhorn Dr
- 8721 Heiferhorn Way
- 1049 Heiferhorn Dr
- 8716 Heiferhorn Way
- 6721 Bridge Way
- 6713 Bridge Way
- 0 Heiferhorn Way Unit 8843518
- 0 Heiferhorn Way