Estimated Value: $1,185,623
Studio
--
Bath
5,054
Sq Ft
$235/Sq Ft
Est. Value
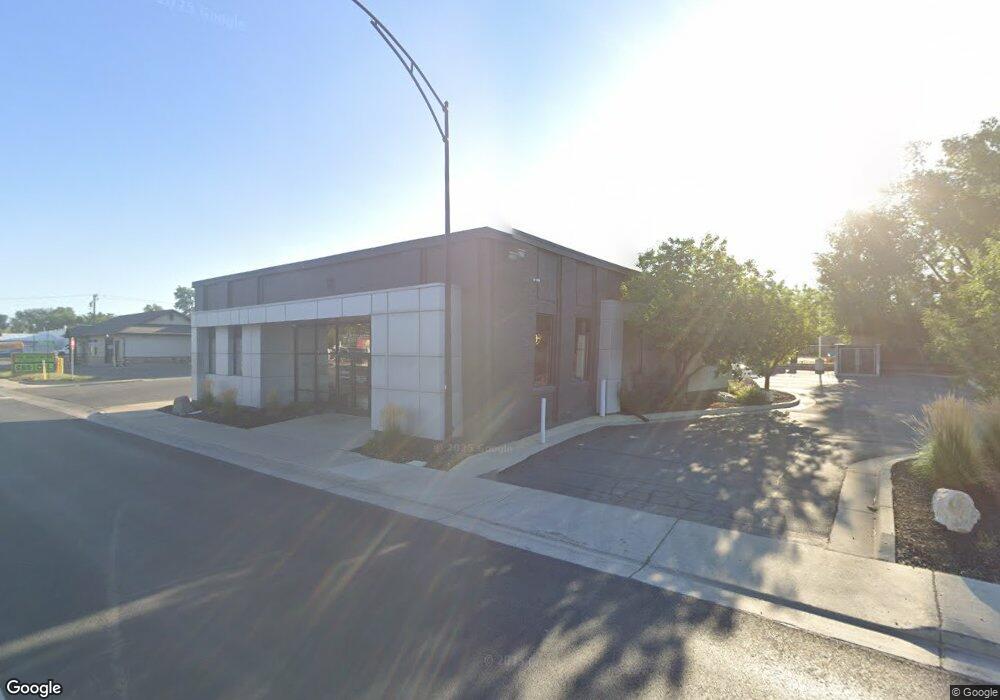
About This Home
This home is located at 8765 S State St, Sandy, UT 84070 and is currently estimated at $1,185,623, approximately $234 per square foot. 8765 S State St is a home located in Salt Lake County with nearby schools including Sandy Elementary School, Mount Jordan Middle School, and Jordan High.
Ownership History
Date
Name
Owned For
Owner Type
Purchase Details
Closed on
Dec 16, 2022
Sold by
Granite Federal Credit Union
Bought by
Ingenium Design Llc
Current Estimated Value
Home Financials for this Owner
Home Financials are based on the most recent Mortgage that was taken out on this home.
Original Mortgage
$806,250
Outstanding Balance
$780,437
Interest Rate
6.95%
Mortgage Type
New Conventional
Estimated Equity
$405,186
Purchase Details
Closed on
Dec 15, 2022
Sold by
Granite Federal Credit Union
Bought by
Ingenium Design Llc
Home Financials for this Owner
Home Financials are based on the most recent Mortgage that was taken out on this home.
Original Mortgage
$806,250
Outstanding Balance
$780,437
Interest Rate
6.95%
Mortgage Type
New Conventional
Estimated Equity
$405,186
Purchase Details
Closed on
May 13, 2005
Sold by
Wells Fargo Bank Northwest N A
Bought by
Granite Credit Union
Create a Home Valuation Report for This Property
The Home Valuation Report is an in-depth analysis detailing your home's value as well as a comparison with similar homes in the area
Home Values in the Area
Average Home Value in this Area
Purchase History
We collect this data history from publicly available records. To have your information removed, we recommend requesting removal directly through your county’s website.
| Date | Buyer | Sale Price | Title Company |
|---|---|---|---|
| Ingenium Design Llc | -- | Artisan Title | |
| Ingenium Design Llc | -- | Artisan Title | |
| Granite Credit Union | -- | First American Title |
Source: Public Records
Mortgage History
We collect this data history from publicly available records. To have your information removed, we recommend requesting removal directly through your county’s website.
| Date | Status | Borrower | Loan Amount |
|---|---|---|---|
| Open | Ingenium Design Llc | $806,250 | |
| Closed | Ingenium Design Llc | $806,250 |
Source: Public Records
Tax History
| Year | Tax Paid | Tax Assessment Tax Assessment Total Assessment is a certain percentage of the fair market value that is determined by local assessors to be the total taxable value of land and additions on the property. | Land | Improvement |
|---|---|---|---|---|
| 2025 | $10,974 | $1,196,600 | $377,600 | $819,000 |
| 2024 | $10,974 | $1,116,300 | $348,900 | $767,400 |
| 2023 | $8,325 | $844,300 | $329,700 | $514,600 |
| 2022 | $6,397 | $633,800 | $382,800 | $251,000 |
| 2021 | $6,718 | $566,600 | $376,200 | $190,400 |
| 2020 | $7,461 | $593,400 | $336,700 | $256,700 |
| 2019 | $6,995 | $542,100 | $336,600 | $205,500 |
| 2018 | $6,961 | $561,700 | $215,100 | $346,600 |
| 2017 | $5,169 | $398,500 | $211,200 | $187,300 |
| 2016 | $5,469 | $407,500 | $198,000 | $209,500 |
| 2015 | $5,910 | $407,500 | $198,000 | $209,500 |
| 2014 | $5,857 | $395,900 | $215,100 | $180,800 |
Source: Public Records
Map
Nearby Homes
- Lot 2 Cottage Rd
- 90 Cottage Ave
- 8522 S Solar Way Unit 8522
- 8812 S Stratford Cir
- 87 Pioneer Ave
- 48 E Apollo Way
- 98 W Settlement Cir
- 33 Apollo Way
- 8780 S 250 E
- 265 E 8880 S Unit 12
- 8808 S Oxford Cir
- 17 Tiny Wood Dr
- 41 W Crawford Place
- 8341 S Wood St
- 36 E Opequon Rd
- 37 Crawford Place
- 8831 S 400 E
- 412 E 8760 S
- 8307 S Durham St
- 60 E Calbourne Ln Unit 3
Your Personal Tour Guide
Ask me questions while you tour the home.