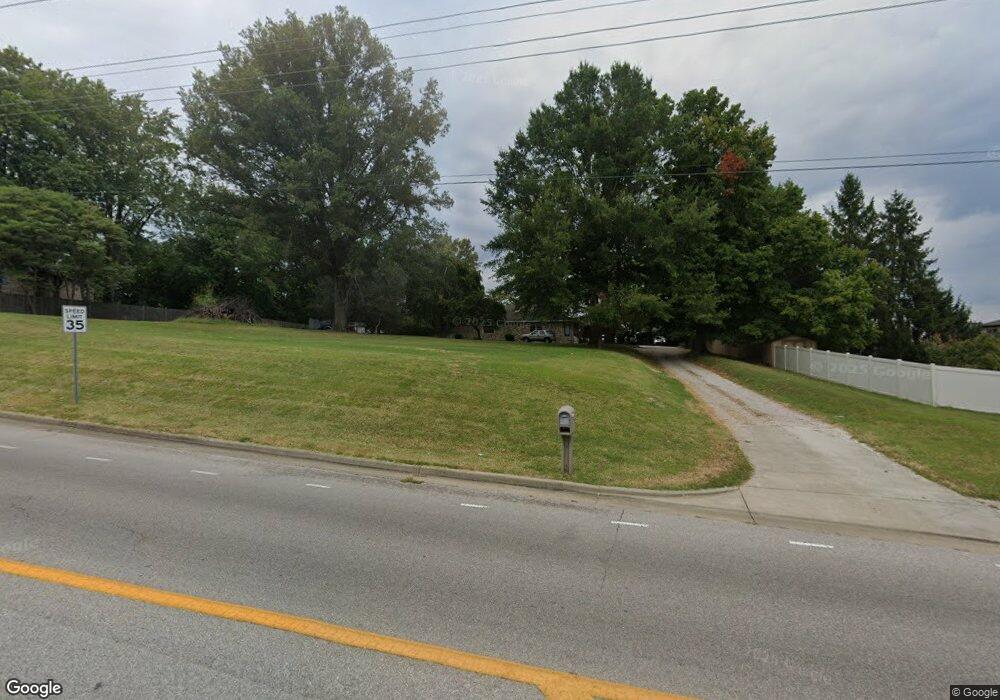
8766 Outer Lincln Ave Newburgh, IN 47630
Estimated Value: $271,000 - $297,000
3
Beds
2
Baths
1,789
Sq Ft
$160/Sq Ft
Est. Value
About This Home
This home is located at 8766 Outer Lincln Ave, Newburgh, IN 47630 and is currently estimated at $286,361, approximately $160 per square foot. 8766 Outer Lincln Ave is a home located in Warrick County with nearby schools including Sharon Elementary School, Castle South Middle School, and Castle High School.
Ownership History
Date
Name
Owned For
Owner Type
Purchase Details
Closed on
Sep 21, 2011
Sold by
Sparks Patty S
Bought by
Board Of Commissioners Of Warrick County
Current Estimated Value
Create a Home Valuation Report for This Property
The Home Valuation Report is an in-depth analysis detailing your home's value as well as a comparison with similar homes in the area
Home Values in the Area
Average Home Value in this Area
Purchase History
| Date | Buyer | Sale Price | Title Company |
|---|---|---|---|
| Board Of Commissioners Of Warrick County | $7,000 | None Available |
Source: Public Records
Tax History Compared to Growth
Tax History
| Year | Tax Paid | Tax Assessment Tax Assessment Total Assessment is a certain percentage of the fair market value that is determined by local assessors to be the total taxable value of land and additions on the property. | Land | Improvement |
|---|---|---|---|---|
| 2024 | $892 | $201,400 | $40,400 | $161,000 |
| 2023 | $733 | $179,600 | $15,800 | $163,800 |
| 2022 | $720 | $171,700 | $15,800 | $155,900 |
| 2021 | $506 | $147,900 | $19,200 | $128,700 |
| 2020 | $476 | $136,900 | $17,200 | $119,700 |
| 2019 | $566 | $137,600 | $17,200 | $120,400 |
| 2018 | $474 | $134,600 | $17,200 | $117,400 |
| 2017 | $430 | $130,600 | $17,200 | $113,400 |
| 2016 | $421 | $129,500 | $17,200 | $112,300 |
| 2014 | $343 | $128,900 | $17,200 | $111,700 |
| 2013 | $353 | $130,300 | $17,200 | $113,100 |
Source: Public Records
Map
Nearby Homes
- 8633 Outer Lincoln Ave
- 8855 Framewood Dr
- 4133 Secretariat Dr
- 9076 Halston Cir
- 8855 Hickory Ln
- 4500 Clint Cir
- 4700 Clint Cir
- 4011 Frame Rd
- 3895 High Pointe Dr
- 4144 Forest Green Dr
- 3879 High Pointe Dr
- 0 Willow Pond Rd
- 8634 Briarose Ct
- 4200 Hare Ct
- 8791 Pebble Creek Dr
- 8511 Pebble Creek Dr
- 8735 Pebble Creek Dr Unit 43
- 8850 Pebble Creek Dr
- 8523 Pebble Creek Dr
- 8750 Pebble Creek Dr
- 8466 Outer Lincln Ave
- 8777 Glennbrooke Dr
- 8755 Glennbrooke Dr
- 4466 Stonegarden Ln
- 4477 Brandywine Dr
- 4455 Brandywine Dr
- 8799 Glennbrooke Dr
- 4499 Brandywine Dr
- 4488 Stonegarden Ln
- 8811 Glennbrooke Dr
- 4433 Brandywine Dr
- 4400 Hawthorne Dr
- 8833 Glennbrooke Dr
- 8777 Lincoln Ave
- 4399 Hawthorne Dr
- 4399 Brandywine Dr
- 4466 Brandywine Dr
- 4444 Brandywine Dr
- 4488 Brandywine Dr
- 4422 Brandywine Dr
