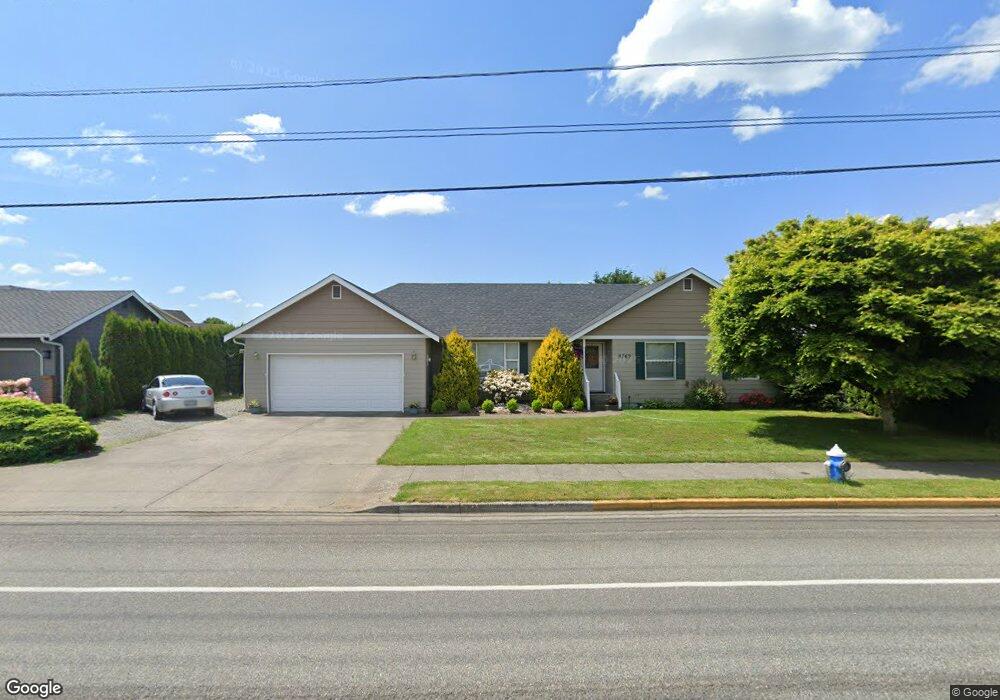
8769 Vinup Rd Lynden, WA 98264
Estimated Value: $615,000 - $750,000
3
Beds
3
Baths
2,179
Sq Ft
$307/Sq Ft
Est. Value
About This Home
This home is located at 8769 Vinup Rd, Lynden, WA 98264 and is currently estimated at $667,964, approximately $306 per square foot. 8769 Vinup Rd is a home located in Whatcom County with nearby schools including Lynden High School, Lynden Christian School, and Lynden Christian Schools: Administration.
Ownership History
Date
Name
Owned For
Owner Type
Purchase Details
Closed on
Mar 2, 2000
Sold by
Meyer Wes and Meyer Jennett
Bought by
Smith Matthew D and Smith Sandra N
Current Estimated Value
Home Financials for this Owner
Home Financials are based on the most recent Mortgage that was taken out on this home.
Original Mortgage
$107,000
Outstanding Balance
$36,211
Interest Rate
8.27%
Estimated Equity
$631,753
Create a Home Valuation Report for This Property
The Home Valuation Report is an in-depth analysis detailing your home's value as well as a comparison with similar homes in the area
Home Values in the Area
Average Home Value in this Area
Purchase History
| Date | Buyer | Sale Price | Title Company |
|---|---|---|---|
| Smith Matthew D | $140,000 | Chicago Title Insurance Co |
Source: Public Records
Mortgage History
| Date | Status | Borrower | Loan Amount |
|---|---|---|---|
| Open | Smith Matthew D | $107,000 |
Source: Public Records
Tax History Compared to Growth
Tax History
| Year | Tax Paid | Tax Assessment Tax Assessment Total Assessment is a certain percentage of the fair market value that is determined by local assessors to be the total taxable value of land and additions on the property. | Land | Improvement |
|---|---|---|---|---|
| 2024 | $4,292 | $605,811 | $218,250 | $387,561 |
| 2023 | $4,292 | $597,655 | $225,000 | $372,655 |
| 2022 | $3,688 | $484,465 | $144,408 | $340,057 |
| 2021 | $3,618 | $400,380 | $119,344 | $281,036 |
| 2020 | $3,169 | $357,491 | $106,560 | $250,931 |
| 2019 | $2,819 | $327,861 | $97,840 | $230,021 |
| 2018 | $3,081 | $299,010 | $89,128 | $209,882 |
| 2017 | $2,773 | $268,387 | $80,000 | $188,387 |
| 2016 | $2,615 | $256,982 | $70,400 | $186,582 |
| 2015 | $2,318 | $240,984 | $67,712 | $173,272 |
| 2014 | -- | $232,821 | $65,408 | $167,413 |
| 2013 | -- | $231,413 | $64,000 | $167,413 |
Source: Public Records
Map
Nearby Homes
- 1136 N Cascade Ct
- 1112 N Cascade Ct
- 1660 Eastwood Way
- 2201 Dejong Dr
- 2205 Dejong Dr
- 1251 Garden Cir
- 1402 Bradley Meadows Ln
- 1319 Bradley Ct
- 9586 Bender Rd
- 8885 Line Rd
- 1725 Aaron Dr
- 8639 Bender Rd
- 2202 Berryman Loop
- 1178 E Grover St Unit 101
- 1792 Bradley Rd
- 114 Twin Sister Loop
- 1095 Terrace Dr
- 1340 Kamm Rd
- 137 E Cedar Dr
- 924 E Grover St
- 8781 Vinup Rd
- 8757 Vinup Rd
- 1890 N Bridgeview Dr
- 1912 N Bridgeview Dr
- 1878 N Bridgeview Dr
- 8785 Vinup Rd
- 8745 Vinup Rd
- 8766 Vinup Rd
- 8774 Vinup Rd
- 1900 N Bridgeview Dr
- 8782 Vinup Rd
- 8758 Vinup Rd
- 8790 Vinup Rd
- 0 S L1s Tara Ct
- 0 L3 Bridgeview Dr
- 0 L8 South Tara Ct
- 0 L6 S Tara Ct
- 0 L8 Colony Ct
- 1924 N Bridgeview Dr
- 8789 Vinup Rd