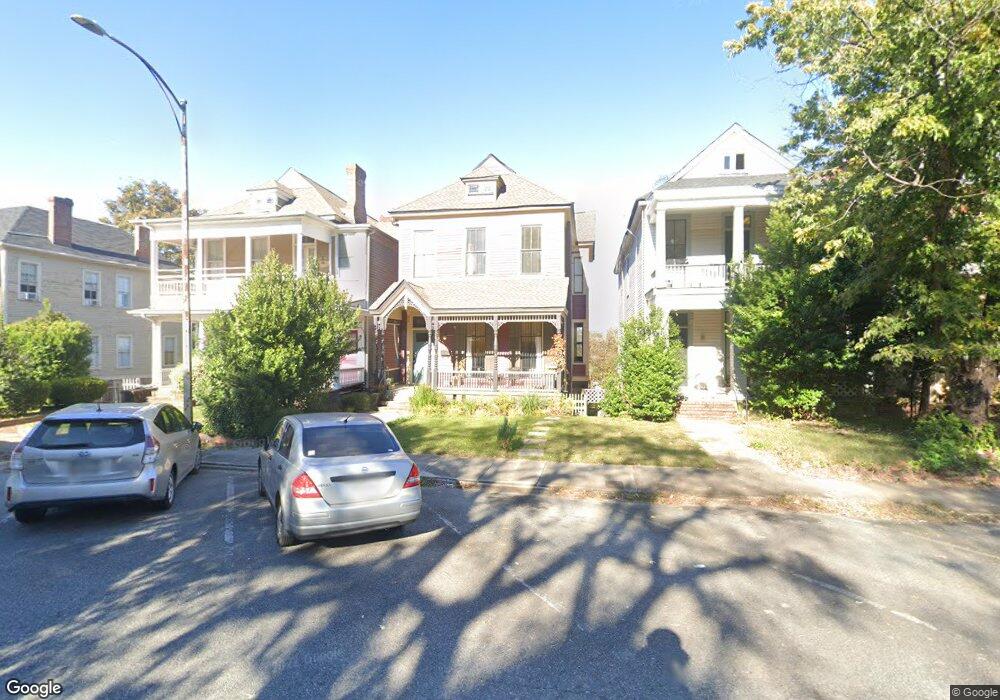
877 Mulberry St Unit C Macon, GA 31201
InTown NeighborhoodEstimated Value: $449,330
Studio
--
Bath
2,648
Sq Ft
$170/Sq Ft
Est. Value
About This Home
This home is located at 877 Mulberry St Unit C, Macon, GA 31201 and is currently estimated at $449,330, approximately $169 per square foot. 877 Mulberry St Unit C is a home located in Bibb County with nearby schools including Ingram-Pye Elementary School, Central High School, and St. Joseph's Catholic School.
Ownership History
Date
Name
Owned For
Owner Type
Purchase Details
Closed on
Nov 8, 2017
Sold by
Emami George
Bought by
Mccaskill Charles D and Mccaskill Allison M
Current Estimated Value
Home Financials for this Owner
Home Financials are based on the most recent Mortgage that was taken out on this home.
Original Mortgage
$175,600
Interest Rate
3.91%
Mortgage Type
Commercial
Purchase Details
Closed on
Aug 17, 2015
Sold by
Herndon Robert E
Bought by
Emami George
Home Financials for this Owner
Home Financials are based on the most recent Mortgage that was taken out on this home.
Original Mortgage
$97,292
Interest Rate
4.16%
Mortgage Type
Future Advance Clause Open End Mortgage
Purchase Details
Closed on
Jul 29, 1976
Sold by
Randall C Sorenson
Bought by
Lane Walter J
Create a Home Valuation Report for This Property
The Home Valuation Report is an in-depth analysis detailing your home's value as well as a comparison with similar homes in the area
Home Values in the Area
Average Home Value in this Area
Purchase History
| Date | Buyer | Sale Price | Title Company |
|---|---|---|---|
| Mccaskill Charles D | $219,500 | None Available | |
| Emami George | $62,500 | None Available | |
| Lane Walter J | -- | -- |
Source: Public Records
Mortgage History
| Date | Status | Borrower | Loan Amount |
|---|---|---|---|
| Closed | Mccaskill Charles D | $175,600 | |
| Previous Owner | Emami George | $97,292 |
Source: Public Records
Tax History
| Year | Tax Paid | Tax Assessment Tax Assessment Total Assessment is a certain percentage of the fair market value that is determined by local assessors to be the total taxable value of land and additions on the property. | Land | Improvement |
|---|---|---|---|---|
| 2025 | $2,915 | $98,576 | $42,240 | $56,336 |
| 2024 | $2,996 | $98,576 | $42,240 | $56,336 |
| 2023 | $3,413 | $98,576 | $42,240 | $56,336 |
| 2022 | $1,854 | $53,556 | $16,220 | $37,336 |
| 2021 | $2,035 | $53,556 | $16,220 | $37,336 |
| 2020 | $2,079 | $53,556 | $16,220 | $37,336 |
| 2019 | $2,291 | $58,535 | $16,220 | $42,315 |
| 2018 | $3,435 | $54,304 | $16,220 | $38,084 |
| 2017 | $1,111 | $29,662 | $16,220 | $13,442 |
| 2016 | $865 | $29,662 | $16,220 | $13,442 |
| 2015 | $823 | $29,662 | $16,220 | $13,442 |
| 2014 | $1,705 | $31,858 | $16,220 | $15,638 |
Source: Public Records
Map
Nearby Homes
- 1120 Georgia Ave
- 417 Orange St
- 312 College St Unit 3
- 522 Cherry St Unit 301
- 522 Cherry St Unit 201
- 534 2nd St
- 349 Madison St
- 353 Madison St
- 132 Madison St
- 619 College St
- 338 Monroe St
- 598 3rd St Unit 3300
- 598 3rd St Unit 3200
- 632 Monroe St
- 940 Cole St
- 980 Highland Terrace
- 1740 5th Ave W
- 988 New St
- 1812 5th Ave W
- 1048 Mckenna Ave
- 877 Mulberry St Unit A
- 877 Mulberry St Unit 3
- 877 Mulberry St Unit 2
- 877 Mulberry St Unit 1
- 877 Mulberry St
- 877 Mulberry St Unit B
- 883 Mulberry St
- 855 Mulberry St
- 895 Mulberry St
- 882 Walnut Street Ln
- 888 Walnut Street Ln
- 870 Mulberry St
- 856 Mulberry St
- 876 Mulberry St
- 808 Mulberry St
- 201 Spring St Unit 3
- 916 Walnut St
- 926 Walnut St Unit B
- 926 Walnut St Unit C
- 926 Walnut St Unit A