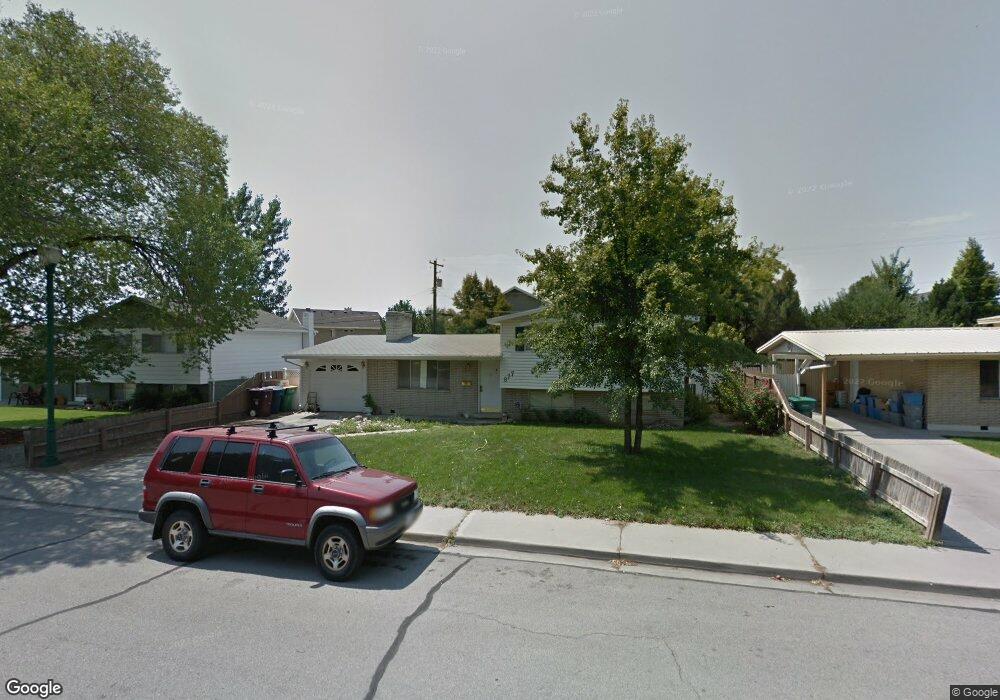
877 N 60 E Orem, UT 84057
Windsor NeighborhoodEstimated Value: $450,000 - $465,000
4
Beds
2
Baths
1,772
Sq Ft
$259/Sq Ft
Est. Value
About This Home
This home is located at 877 N 60 E, Orem, UT 84057 and is currently estimated at $459,691, approximately $259 per square foot. 877 N 60 E is a home located in Utah County with nearby schools including Windsor School, Canyon View Junior High School, and Timpanogos High School.
Ownership History
Date
Name
Owned For
Owner Type
Purchase Details
Closed on
Nov 26, 2003
Sold by
Phillips Beverley M
Bought by
Mu Joseph Ah and Mu Cindy Ah
Current Estimated Value
Home Financials for this Owner
Home Financials are based on the most recent Mortgage that was taken out on this home.
Original Mortgage
$130,945
Outstanding Balance
$59,422
Interest Rate
6.04%
Mortgage Type
FHA
Estimated Equity
$400,269
Purchase Details
Closed on
Mar 31, 2000
Sold by
Phillips Beverly
Bought by
Phillips Beverly M
Home Financials for this Owner
Home Financials are based on the most recent Mortgage that was taken out on this home.
Original Mortgage
$124,233
Interest Rate
8.38%
Mortgage Type
FHA
Purchase Details
Closed on
Dec 29, 1999
Sold by
Utah Housing Finance Agency
Bought by
Hud
Create a Home Valuation Report for This Property
The Home Valuation Report is an in-depth analysis detailing your home's value as well as a comparison with similar homes in the area
Home Values in the Area
Average Home Value in this Area
Purchase History
| Date | Buyer | Sale Price | Title Company |
|---|---|---|---|
| Mu Joseph Ah | -- | Affiliated First Title Comp | |
| Phillips Beverly M | -- | Equity Title Agency Inc | |
| Phillips Beverly | -- | Equity Title Agency Inc | |
| Hud | -- | -- | |
| Utah Housing Finance Agency | -- | -- |
Source: Public Records
Mortgage History
| Date | Status | Borrower | Loan Amount |
|---|---|---|---|
| Open | Mu Joseph Ah | $130,945 | |
| Previous Owner | Phillips Beverly | $124,233 |
Source: Public Records
Tax History
| Year | Tax Paid | Tax Assessment Tax Assessment Total Assessment is a certain percentage of the fair market value that is determined by local assessors to be the total taxable value of land and additions on the property. | Land | Improvement |
|---|---|---|---|---|
| 2025 | $1,817 | $223,190 | -- | -- |
| 2024 | $1,817 | $222,145 | $0 | $0 |
| 2023 | $1,713 | $225,115 | $0 | $0 |
| 2022 | $1,692 | $215,435 | $0 | $0 |
| 2021 | $1,462 | $282,000 | $129,500 | $152,500 |
| 2020 | $1,335 | $253,100 | $103,600 | $149,500 |
| 2019 | $1,233 | $243,000 | $93,500 | $149,500 |
| 2018 | $1,134 | $213,500 | $83,500 | $130,000 |
| 2017 | $1,042 | $105,105 | $0 | $0 |
| 2016 | $975 | $90,695 | $0 | $0 |
| 2015 | $937 | $82,445 | $0 | $0 |
| 2014 | $931 | $81,510 | $0 | $0 |
Source: Public Records
Map
Nearby Homes
- 16 E 925 N
- 917 N Garden Dr
- 789 200 E Unit 787
- 125 W 870 N
- 620 N 120 E
- 362 E 800 N Unit 1
- 512 N 100 E
- 171 E 500 N
- 597 N State St Unit 25
- 372 E 1165 N
- 471 E 700 N
- 337 Birchwood Dr
- 33 W 400 N
- 305 E Elmwood Dr
- 307 E Elmwood Dr
- 369 N Main St Unit 2
- 976 N 560 E
- 1371 N 330 E Unit 8
- 311 N 330 E
- 241 W 310 St N
- 867 N 60 E
- 889 N 60 E
- 888 N Main St
- 886 N Main St
- 886 N Main St Unit 20
- 884 N Main St
- 884 N Main St Unit 19
- 896 N Main St
- 882 N Main St
- 882 N Main St Unit 18
- 901 N 60 E
- 857 N 60 E
- 874 N Main St
- 894 N Main St
- 894 N Main St Unit 13
- 878 N 60 E
- 880 N Main St
- 880 N Main St Unit 17
- 868 N 60 E
- 892 N Main St
Your Personal Tour Guide
Ask me questions while you tour the home.