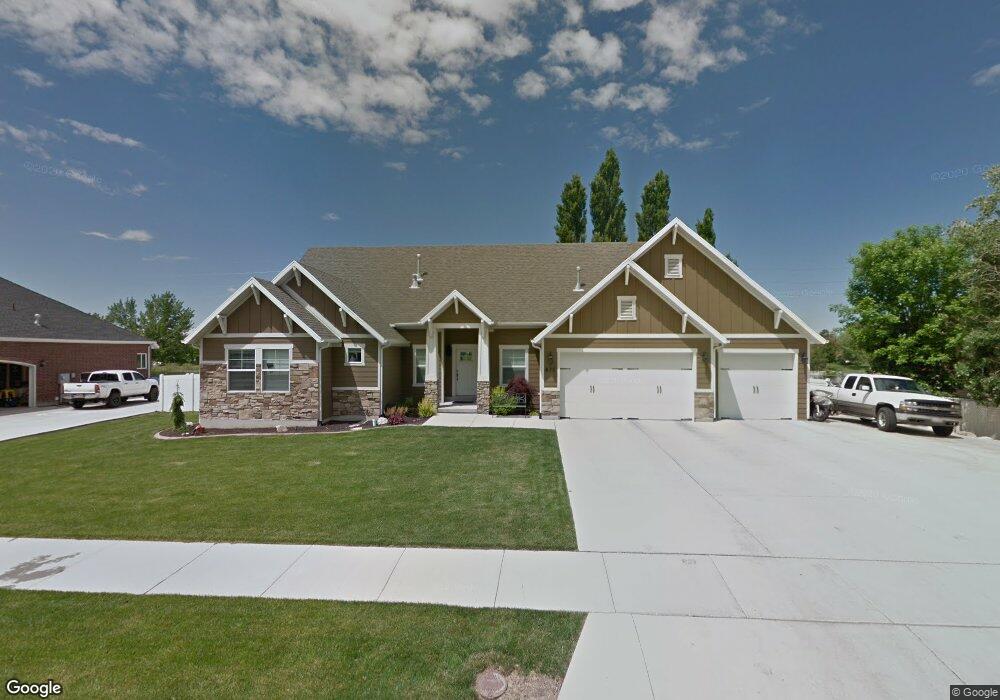
877 N 900 W Unit 1 West Bountiful, UT 84087
Estimated Value: $787,425 - $1,248,000
5
Beds
3
Baths
2,399
Sq Ft
$387/Sq Ft
Est. Value
About This Home
This home is located at 877 N 900 W Unit 1, West Bountiful, UT 84087 and is currently estimated at $928,856, approximately $387 per square foot. 877 N 900 W Unit 1 is a home located in Davis County with nearby schools including West Bountiful Elementary School, Bountiful Junior High School, and Viewmont High School.
Ownership History
Date
Name
Owned For
Owner Type
Purchase Details
Closed on
May 21, 2018
Sold by
Rowberry Diane and Pirela Heberto
Bought by
Pirela Heberto
Current Estimated Value
Purchase Details
Closed on
Apr 20, 2012
Sold by
Pirela Herberto and Rowberry Diane
Bought by
Rowberry Diane and Pirela Heberto
Home Financials for this Owner
Home Financials are based on the most recent Mortgage that was taken out on this home.
Original Mortgage
$296,000
Interest Rate
3.9%
Mortgage Type
New Conventional
Purchase Details
Closed on
Mar 2, 2012
Sold by
H D Pirela Lc
Bought by
Pirela Heberto and Rowberry Diane
Home Financials for this Owner
Home Financials are based on the most recent Mortgage that was taken out on this home.
Original Mortgage
$296,000
Interest Rate
3.9%
Mortgage Type
New Conventional
Purchase Details
Closed on
Mar 17, 2011
Sold by
Abj Development Inc
Bought by
H D Pirela L C
Create a Home Valuation Report for This Property
The Home Valuation Report is an in-depth analysis detailing your home's value as well as a comparison with similar homes in the area
Home Values in the Area
Average Home Value in this Area
Purchase History
| Date | Buyer | Sale Price | Title Company |
|---|---|---|---|
| Pirela Heberto | -- | Mountain View Title | |
| Rowberry Diane | -- | Aspen Title Insuranc | |
| Pirela Heberto | -- | Aspen Title Insuranc | |
| H D Pirela L C | -- | Aspen Title Insuranc |
Source: Public Records
Mortgage History
| Date | Status | Borrower | Loan Amount |
|---|---|---|---|
| Previous Owner | Rowberry Diane | $296,000 |
Source: Public Records
Tax History Compared to Growth
Tax History
| Year | Tax Paid | Tax Assessment Tax Assessment Total Assessment is a certain percentage of the fair market value that is determined by local assessors to be the total taxable value of land and additions on the property. | Land | Improvement |
|---|---|---|---|---|
| 2025 | $4,794 | $417,450 | $158,700 | $258,750 |
| 2024 | $4,435 | $394,349 | $131,063 | $263,286 |
| 2023 | $4,307 | $386,100 | $134,179 | $251,920 |
| 2022 | $4,128 | $682,000 | $218,526 | $463,474 |
| 2021 | $3,979 | $556,000 | $168,189 | $387,811 |
| 2020 | $3,378 | $464,000 | $151,286 | $312,714 |
| 2019 | $3,299 | $448,000 | $148,957 | $299,043 |
| 2018 | $3,119 | $416,000 | $143,651 | $272,349 |
| 2016 | $2,938 | $212,630 | $66,917 | $145,713 |
| 2015 | $2,995 | $206,140 | $66,917 | $139,223 |
| 2014 | $3,033 | $214,677 | $66,917 | $147,760 |
| 2013 | -- | $169,946 | $41,360 | $128,586 |
Source: Public Records
Map
Nearby Homes
- 825 W 1320 N
- 280 N 1100 W
- 767 W 220 N
- 1084 W Audrey Ln Unit 20
- 1084 W Audrey Ln
- 790 N 500 W
- 1520 N 550 W
- 366 W 1000 N
- 340 N 500 W Unit 204
- 789 W 1950 N
- 988 W 1950 N Unit 134
- 399 W 400 N Unit 47
- 680 W 500 S Unit 22
- 680 W 500 S Unit 17
- Hampton Traditional Plan at Belmont Farms
- Carson Plan at Amberly Place
- 2050 Farmhouse Plan at Amberly Place
- Pasadena (Inactive) Plan at Amberly Place
- Portland Plan at Amberly Place
- 2035 N 800 W
- 877 N 900 W
- 893 N 900 W
- 853 N 900 W
- 907 N 900 W
- 923 N 900 W
- 888 W Heritage Point Ln Unit 9
- 937 N 900 W
- 895 Raintree Cir
- 829 N 900 W Unit 3
- 829 N 900 W
- 834 N 900 W Unit 25
- 951 N 900 W
- 889 Raintree Cir
- 932 N 900 W
- 965 N 900 W
- 876 W 850 N Unit 10
- 885 Raintree Cir
- 812 N 900 W Unit 26
- 805 N 900 W Unit 4
- 981 N 900 W